


The Welsh Index of Multiple Deprivation (WIMD) 2019 (PDF, 8MB) was published on 27 November 2019 by the Welsh Government.
Most deprived and least deprived areas
The headline WIMD 2019 results in the table below show the 5 most deprived and 5 least deprived small areas known as Lower Super Output Areas (LSOAs).
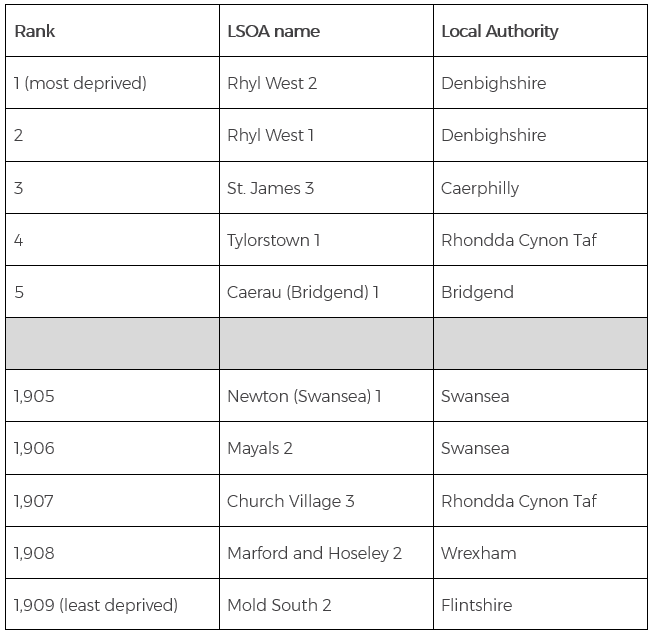 Source: Welsh Government, Welsh Index of Multiple Deprivation 2019 – Results report (PDF, 8MB)
The Welsh Government has produced an interactive tool which allows users to explore the data, including searching by postcode and by Assembly Constituency. The results report (PDF, 8MB) also contains analysis of small areas of ‘deep-rooted’ deprivation where LSOAs have stayed in the top 50 most deprived small areas since 2005.
What is WIMD 2019?
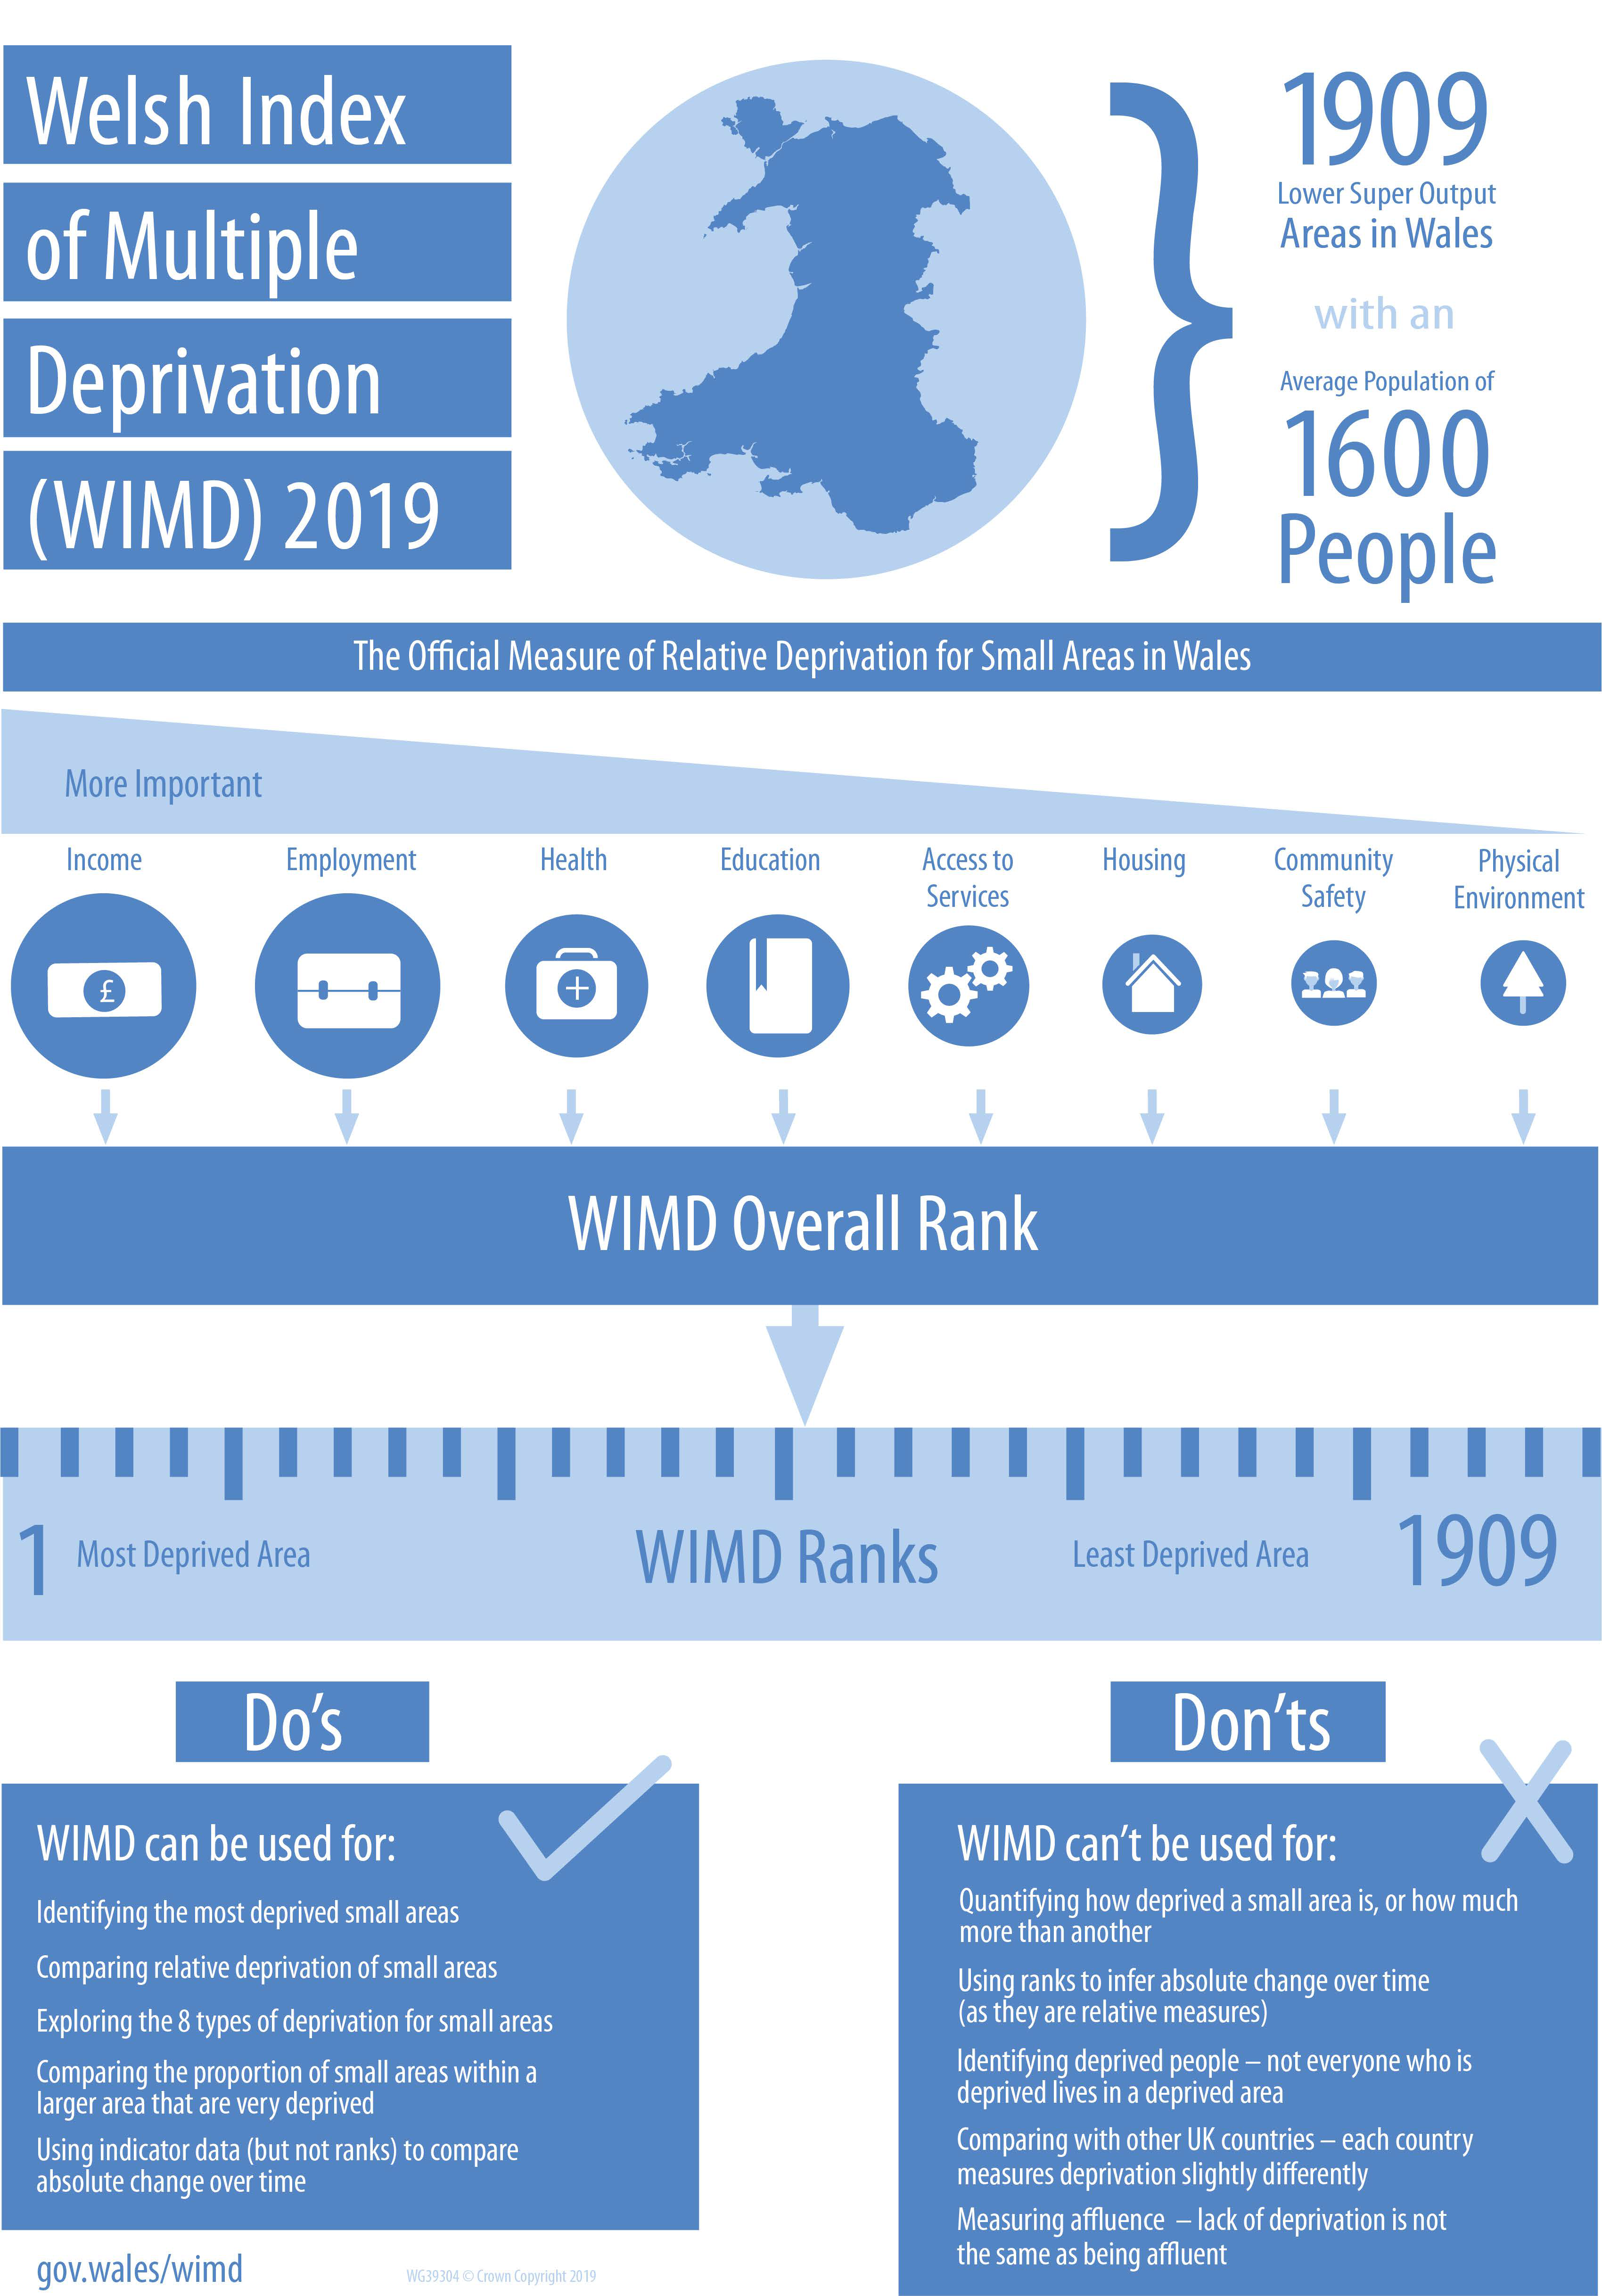
WIMD 2019 attempts to measure relative levels of deprivation in small areas across Wales. The small areas used to construct the index are known as Lower Super Output Areas (LSOAs) with an average population of 1,600 people. There are 1,909 LSOAs in Wales - the most deprived area is given a rank of 1 and the least deprived a rank of 1,909.
WIMD 2019 uses a range of indicators across eight domains to measure the concept of ‘multiple deprivation’. The domains are listed below and the percentages in brackets show the weighting or importance given to each domain as an aspect of deprivation:
- Income (22%)
- Employment (22%)
- Health (15%)
- Education (14%)
- Access to services (10%)
- Housing (7%)
- Community safety (5%)
- Physical Environment (5%)
How does WIMD 2019 differ to WIMD 2014?
The methodology of WIMD 2019 is broadly similar to WIMD 2014. There are still eight domains of deprivation with small changes to the relative weights applied to each domain. There are several new indicators (ODP, 6MB) in the following domains;
- Health – GP recorded chronic and mental health conditions and children aged 4-5 who are obese
- Education - Foundation Phase average point score
- Housing – modelled poor housing quality
- Physical environment – proximity to accessible natural green space
- Access to services – premises without broadband speed of at least 30 Mbits/s available and travel time to services by public transport
Why is WIMD important?
National and local government programmes that aim to tackle deprivation often use WIMD to target funding in the most deprived areas. The Valleys Taskforce uses WIMD data to help determine the location of strategic hubs and for baseline data on deprivation. The National Development Framework (NDF) consultation documents use WIMD as part of their evidence base. The income indicator data underlying WIMD has also been used to identify where Flying Start services are placed. Higher Education Funding Council for Wales (HEFCW) also use WIMD in their strategic priority to Widen Access to Higher Education. In addition WIMD is used to measure health inequalities as well as helping local authorities develop needs assessments and estimating demands on emergency services.
How often is WIMD updated?
WIMD was first published in 2000 at an electoral division level. Subsequent versions of WIMD were published in 2005, 2008, 2011 and 2014 at LSOA level.
Can comparisons be made with other countries?
England, Scotland and Northern Ireland all have their own separate Indices of Multiple Deprivation (IMDs). The English Index of Multiple Deprivation 2019 was updated in September 2019. The Scottish Index of Multiple Deprivation 2016 is planned to be updated in 2020 and the Northern Ireland Multiple Deprivation Measure 2017 is the latest version available.
It is not possible to compare the WIMD with the IMDs from other UK countries as they all use different indicators, are updated at different time periods and have different underlying geographies.
Are there any limitations to using WIMD?
WIMD is a useful tool for measuring concentrations of many types of deprivation at a small geographical level. However its main limitation is that it is an area based measure. People that would be considered deprived can live in the least deprived areas and vice versa.
Respondents to the Welsh Government’s consultation on the proposed indicators for WIMD 2019 (PDF, 1MB) also commented that deprivation in rural areas tends to be more geographically dispersed than in urban areas. Therefore pockets of deprivation in rural areas are likely to be below LSOA level and harder to identify.
WIMD is also not a direct measure of the amount of deprivation in an area. It is possible to say that one area is more deprived than another however it is not possible to state that one LSOA is twice as deprived as another LSOA. It is also not possible to compare the WIMD 2014 ranks with WIMD 2019 ranks. In order to make comparisons over time it is often possible to use the annual WIMD indicator data which are published on StatsWales.
Article by Helen Jones, Senedd Research, National Assembly for Wales
