
Much has changed in Wales in the twenty years since the first National Assembly for Wales was elected in May 1999. This is the first in a series of articles that attempts to describe some of that change. It has been prepared by Senedd Research as part of the Assembly’s activity to mark twenty years of devolution.
- In 2017, an estimated 3.125 million people lived in Wales an increase of 225,000 people (or 7.7 %) from 1999
- The biggest contributor to population growth in the last 20 years was moves within the UK, mainly from England to Wales.
- Between 2001 and 2011, the percentage of the Welsh population describing their ethnic group as White British fell from 96.0% to 93.2%, whilst the percentage describing themselves as non-White (including mixed) ethnic groups increased from 2.1% to 4.0%.
- The average age of the population is expected to increase by 2.5 years in the next 20 years, and the population of people aged 65 and over is expected to grow by 30%.
- The number of Welsh speakers in Wales is increasing and was about one in five people at the time of the last census in 2011.
Population
The population of Wales grew by 225,000 (or 7.7 %) between 1999 and 2017, according to the latest mid-year population estimates produced by the Office for National Statistics (ONS). Data on migration flows is only available from 2001 to 2017 so the following analysis focuses on this period.
How is population changing in your area? The chart below shows the percentage change in population of each local authority from 2001 to 2017.
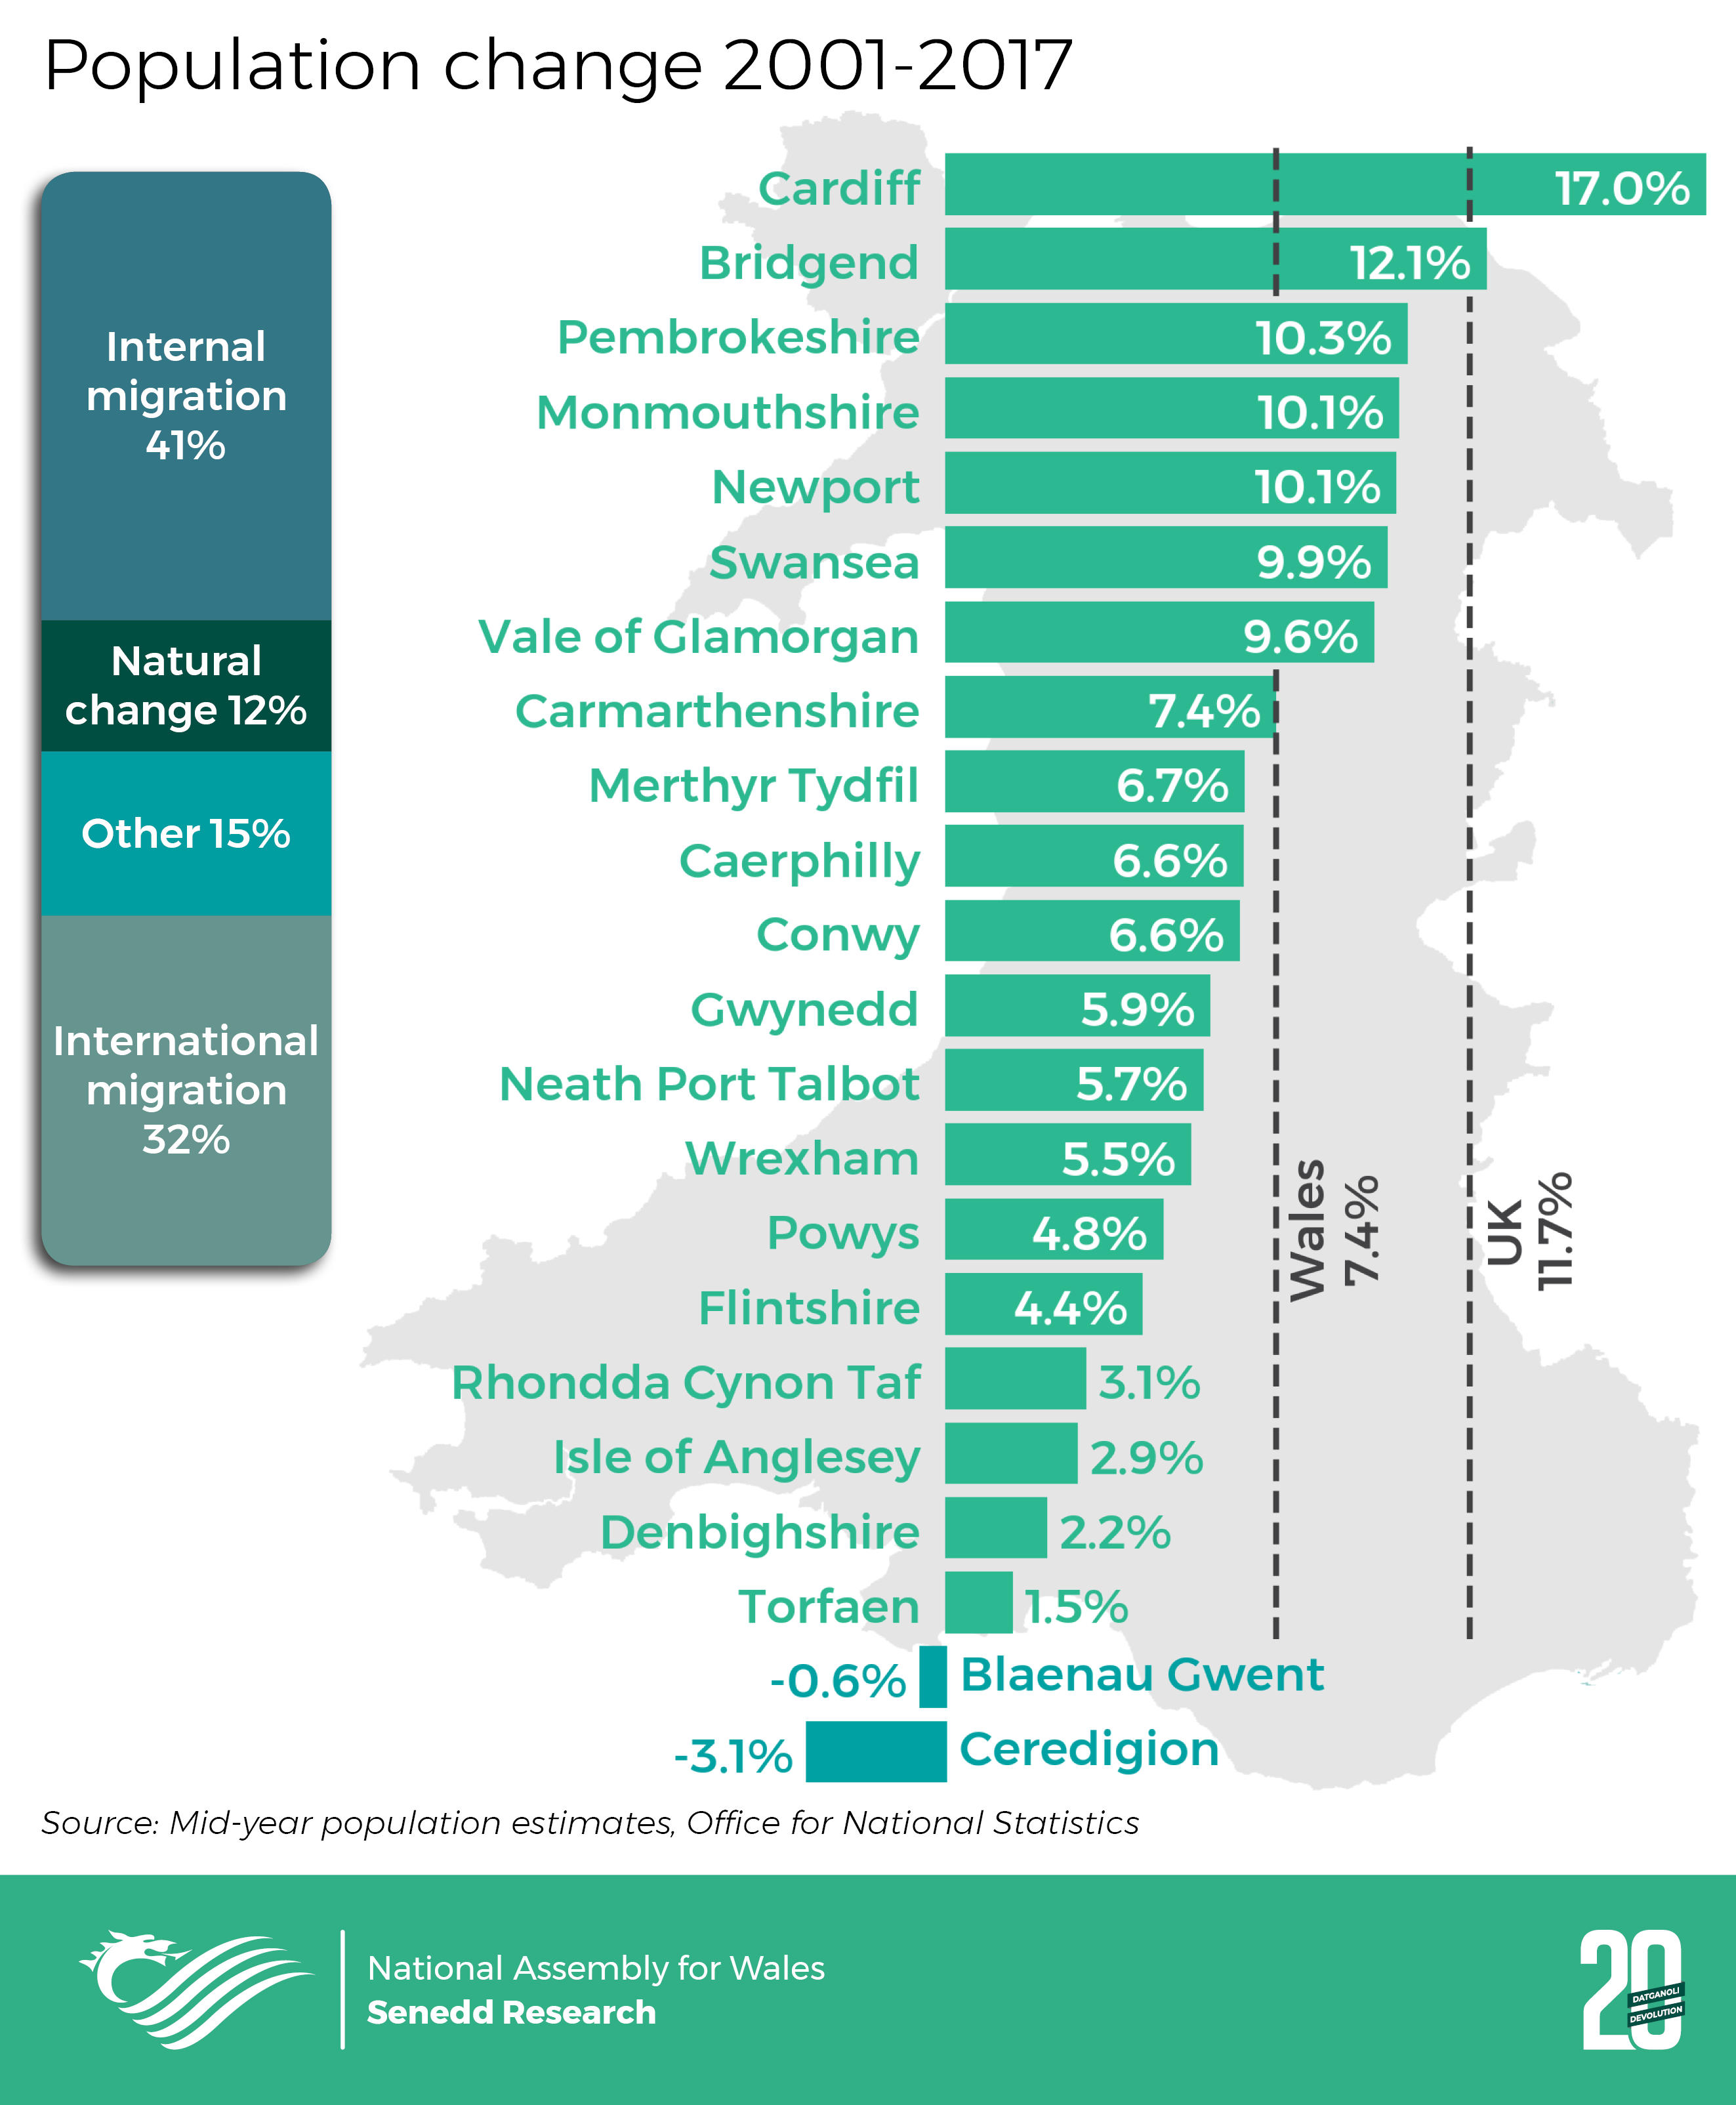
The local authority with the biggest population increase was Cardiff (17.0%) where growth was above both the Wales average (7.4%) and the UK average (11.7%). A population decrease was observed in Blaenau Gwent and Ceredigion.
The drivers of growth in the population of Wales were:
- Internal migration between UK countries: 85,000 (41%).
- International migration between Wales and non-UK countries: 66,000 (32%).
- Natural change (births minus deaths): 24,000 (12%).
- Other changes such as armed forces, prison populations and inaccuracies in the estimation: 32,000 (15%).
The largest contributor to internal migration was moves from England to Wales. ONS internal migration statistics estimate that since 1999, there were 59,000 moves from England per year on average. In contrast, there were 53,000 per year in the opposite direction.
Ethnicity, religion and national identity
Between the 2001 and 2011 censuses, the percentage of the Welsh population describing their ethnic group as White British fell from 96.0% to 93.2% whilst the percentage describing themselves as non-White (including mixed) ethnic groups increased from 2.1 to 4.0%. Wales remains markedly less diverse than England and Wales taken together, where 80.5% of people identified as White British in 2011.
Those describing their ethnic group as Asian are the second largest ethnic group in Wales. Between 2001 and 2011 the percentage of the Welsh population describing their ethnic group as Asian increased from 1.1% (32,000) to 2.3% (71,000).
The population of non-White ethnic groups is centred on the southern cities. The local authorities in Wales with the lowest proportion of the population describing their ethnic group as White in 2011 were Cardiff (84.8%), Newport (89.9%) and Swansea (94.1%).
Between 2001 and 2011 the percentage of the Welsh population giving their religion as Christian fell from 71.9% to 57.6%. whilst the percentage of the population saying they had no religion increased by 445,000 (from 18.5% to 32.1%). The second largest religious group was Muslims with 46,000 people (1.5% of the population), up from 22,000 (0.7%) in 2001.
2011 was the first year the census asked a question about national identity. Nearly two-thirds (66%. 2.0 million) of Welsh residents expressed their national identity as Welsh: of these, 218,000 (7.1% of the total population) also reported that they considered themselves to be British.
International migration
In 2017, the number of people resident in Wales with a non-UK country of birth was 196,000 (6.4% of the population), up from 75,000 (2.6% of the population) in 2001. For the UK as a whole, this rose from 8.3% to 14% in the same period.
Where do people move to Wales from? Inward migration has increased since 1999. On the atlas below, the arrow widths are scaled to represent the proportion of moves to Wales from each continent during the period 1999-2017.
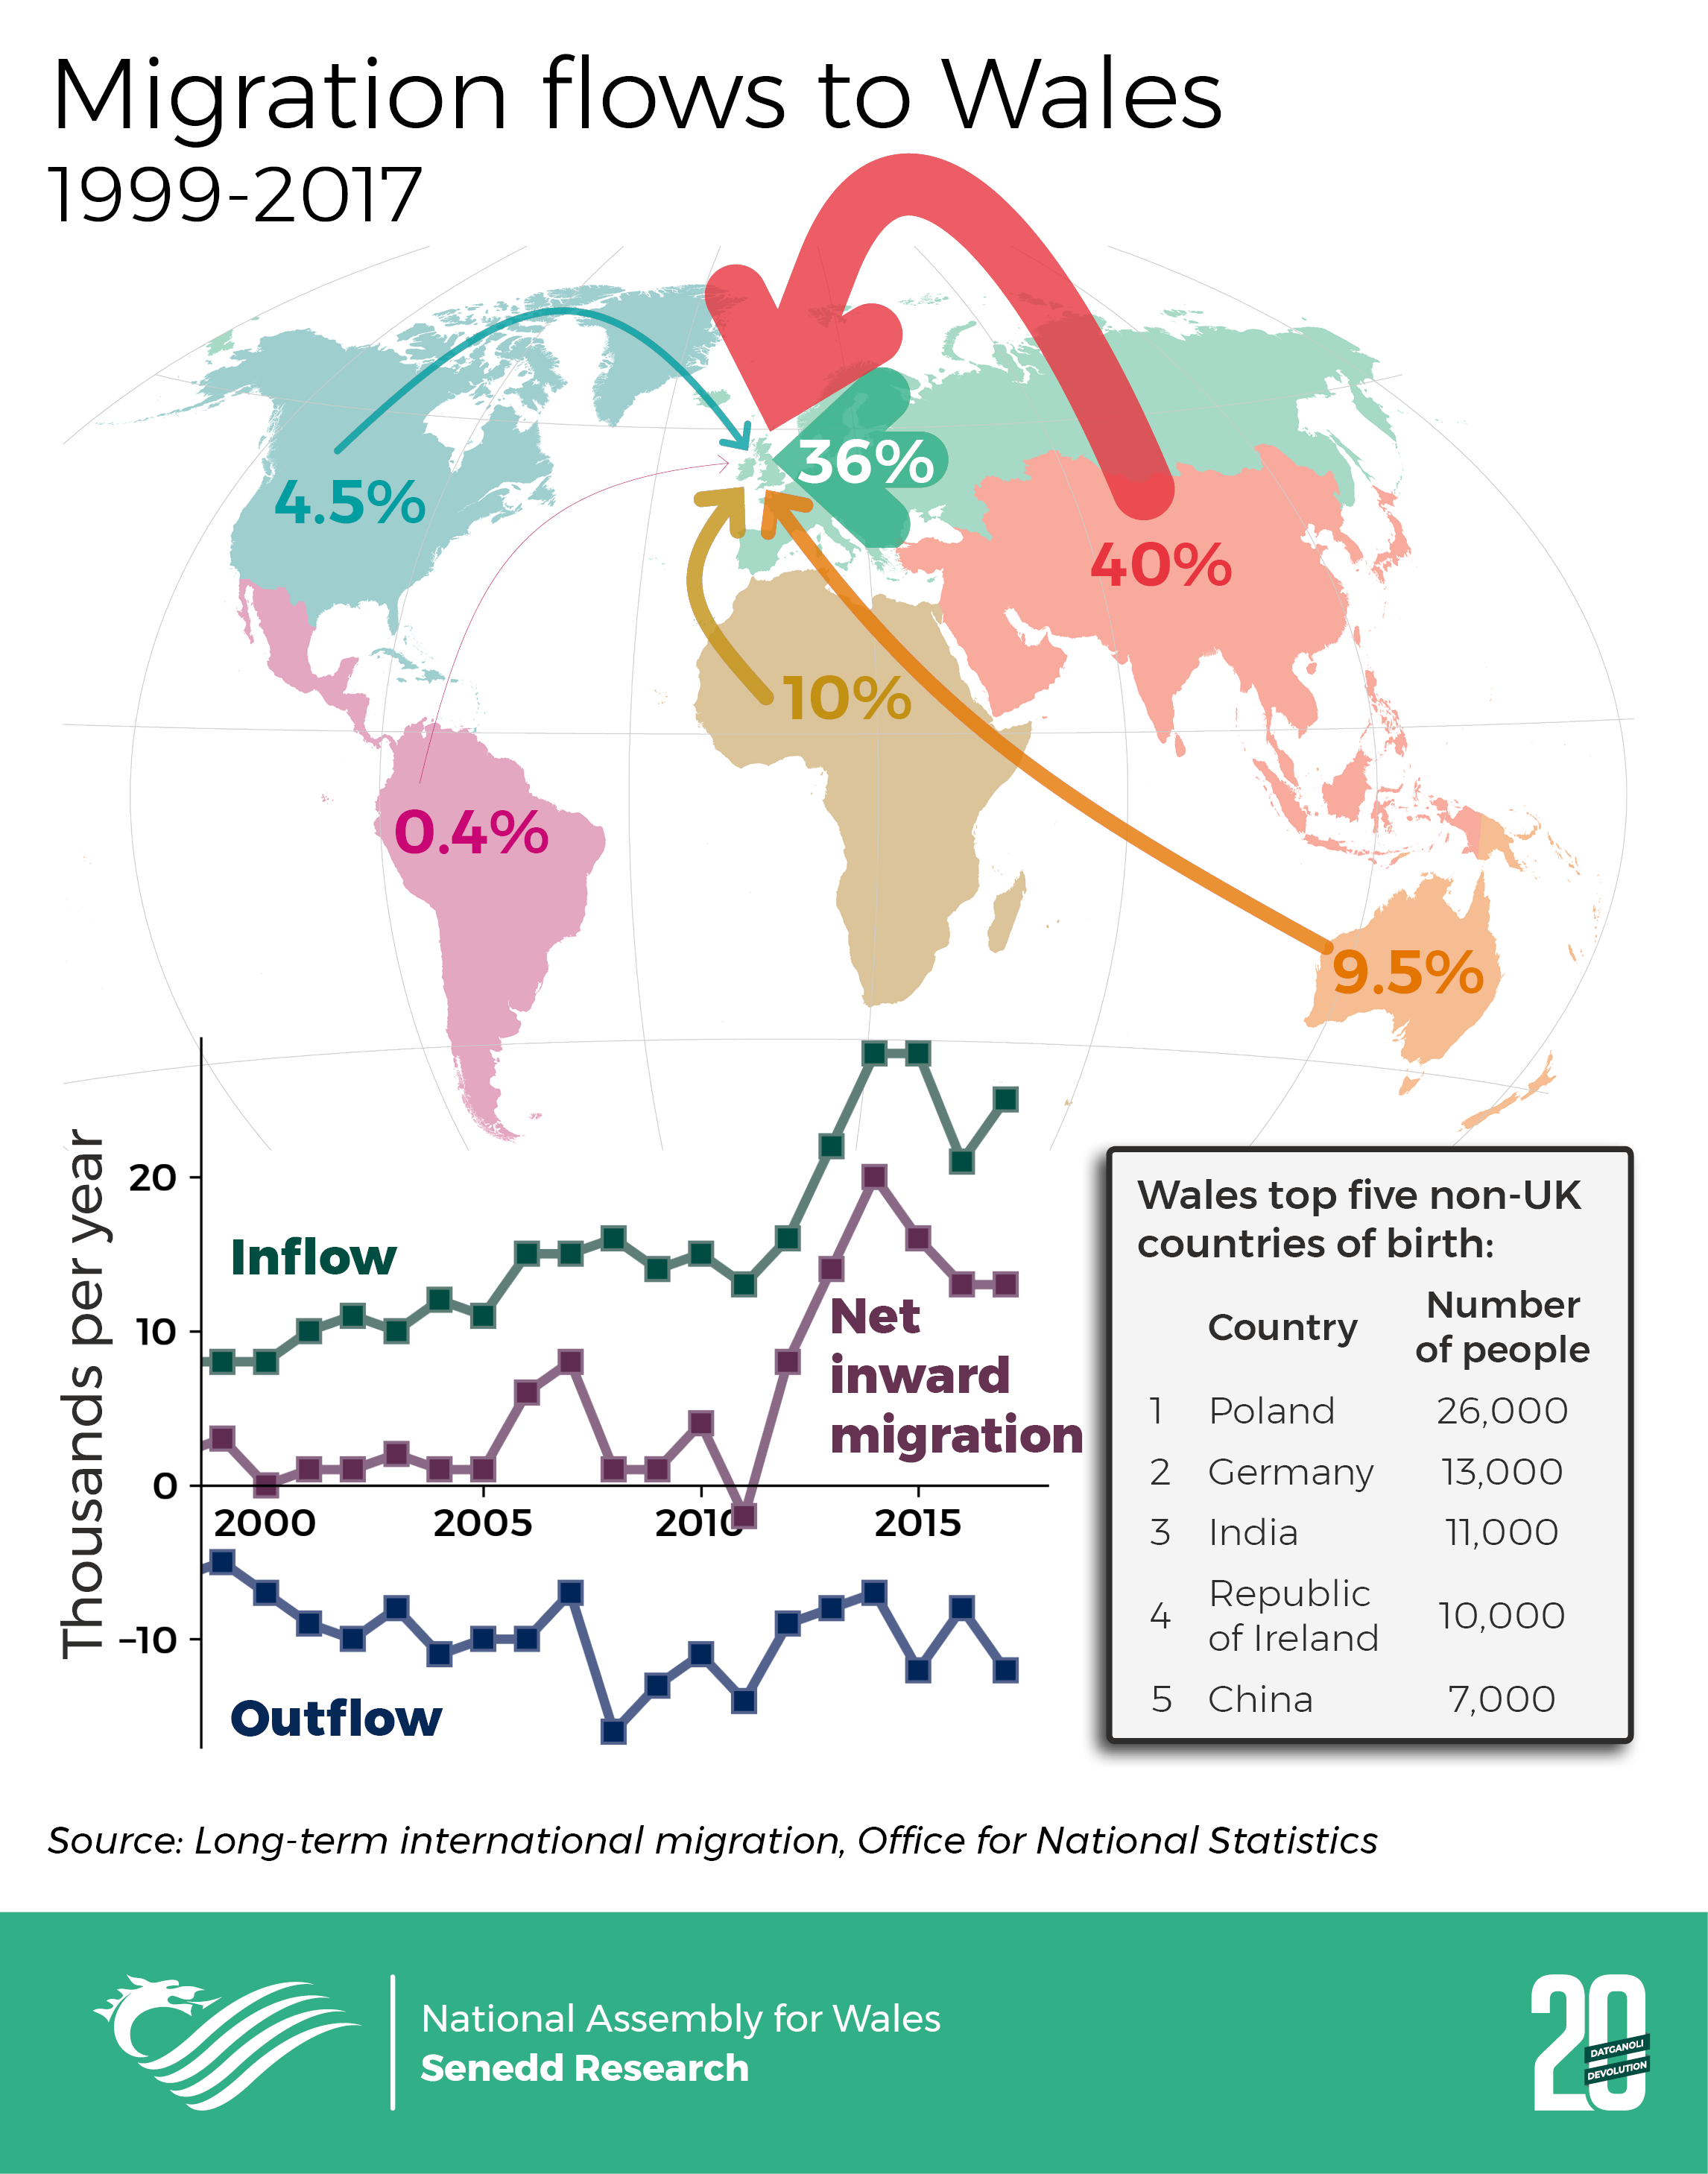
The most rapid increase occurred from 2011 to 2014 and peaked at 28,000 migrants per year. Outward migration was slightly steadier and largely balanced inward migration until about 2012. From 2013-2017 inflow exceeded outflow by more than 10,000 people per year.
Factors that influence migration, such as the UK’s relationship with the EU, are unpredictable. Combined with the volatility in the data, this makes it difficult to produce a future projection of migration.
Births and deaths
People are having fewer children. Between 1999 and 2017, the number of births per year peaked in 2010 at 2.3 live births per 100 women. Since then, it has steadily decreased to 2.0 live births per 100 women. The age at which women give birth is increasing. The proportion of births by women under 25 years of age dropped from 32% to 23% from 2004 to 2017.
People are living longer: Between 1999 and 2014, life expectancies steadily increased by 3.7 years for males and 2.6 years for females. For the period 2012-2014, male and female life expectancies were 78.5 and 82.3, respectively.
Age distribution
The population pyramids below show the number of males and females of each single year of age. Ripples in the distribution’s width reflect differences in birth and death rates between generations. For example, the spikes in the number of people aged 52 in 1999 and aged 70 in 2017 (indicated by arrows) are due to the post-war baby boom.
The age distributions of males largely reflects that of females. One exception is that in 1999, there were substantially fewer men than women in the over 60 age group.
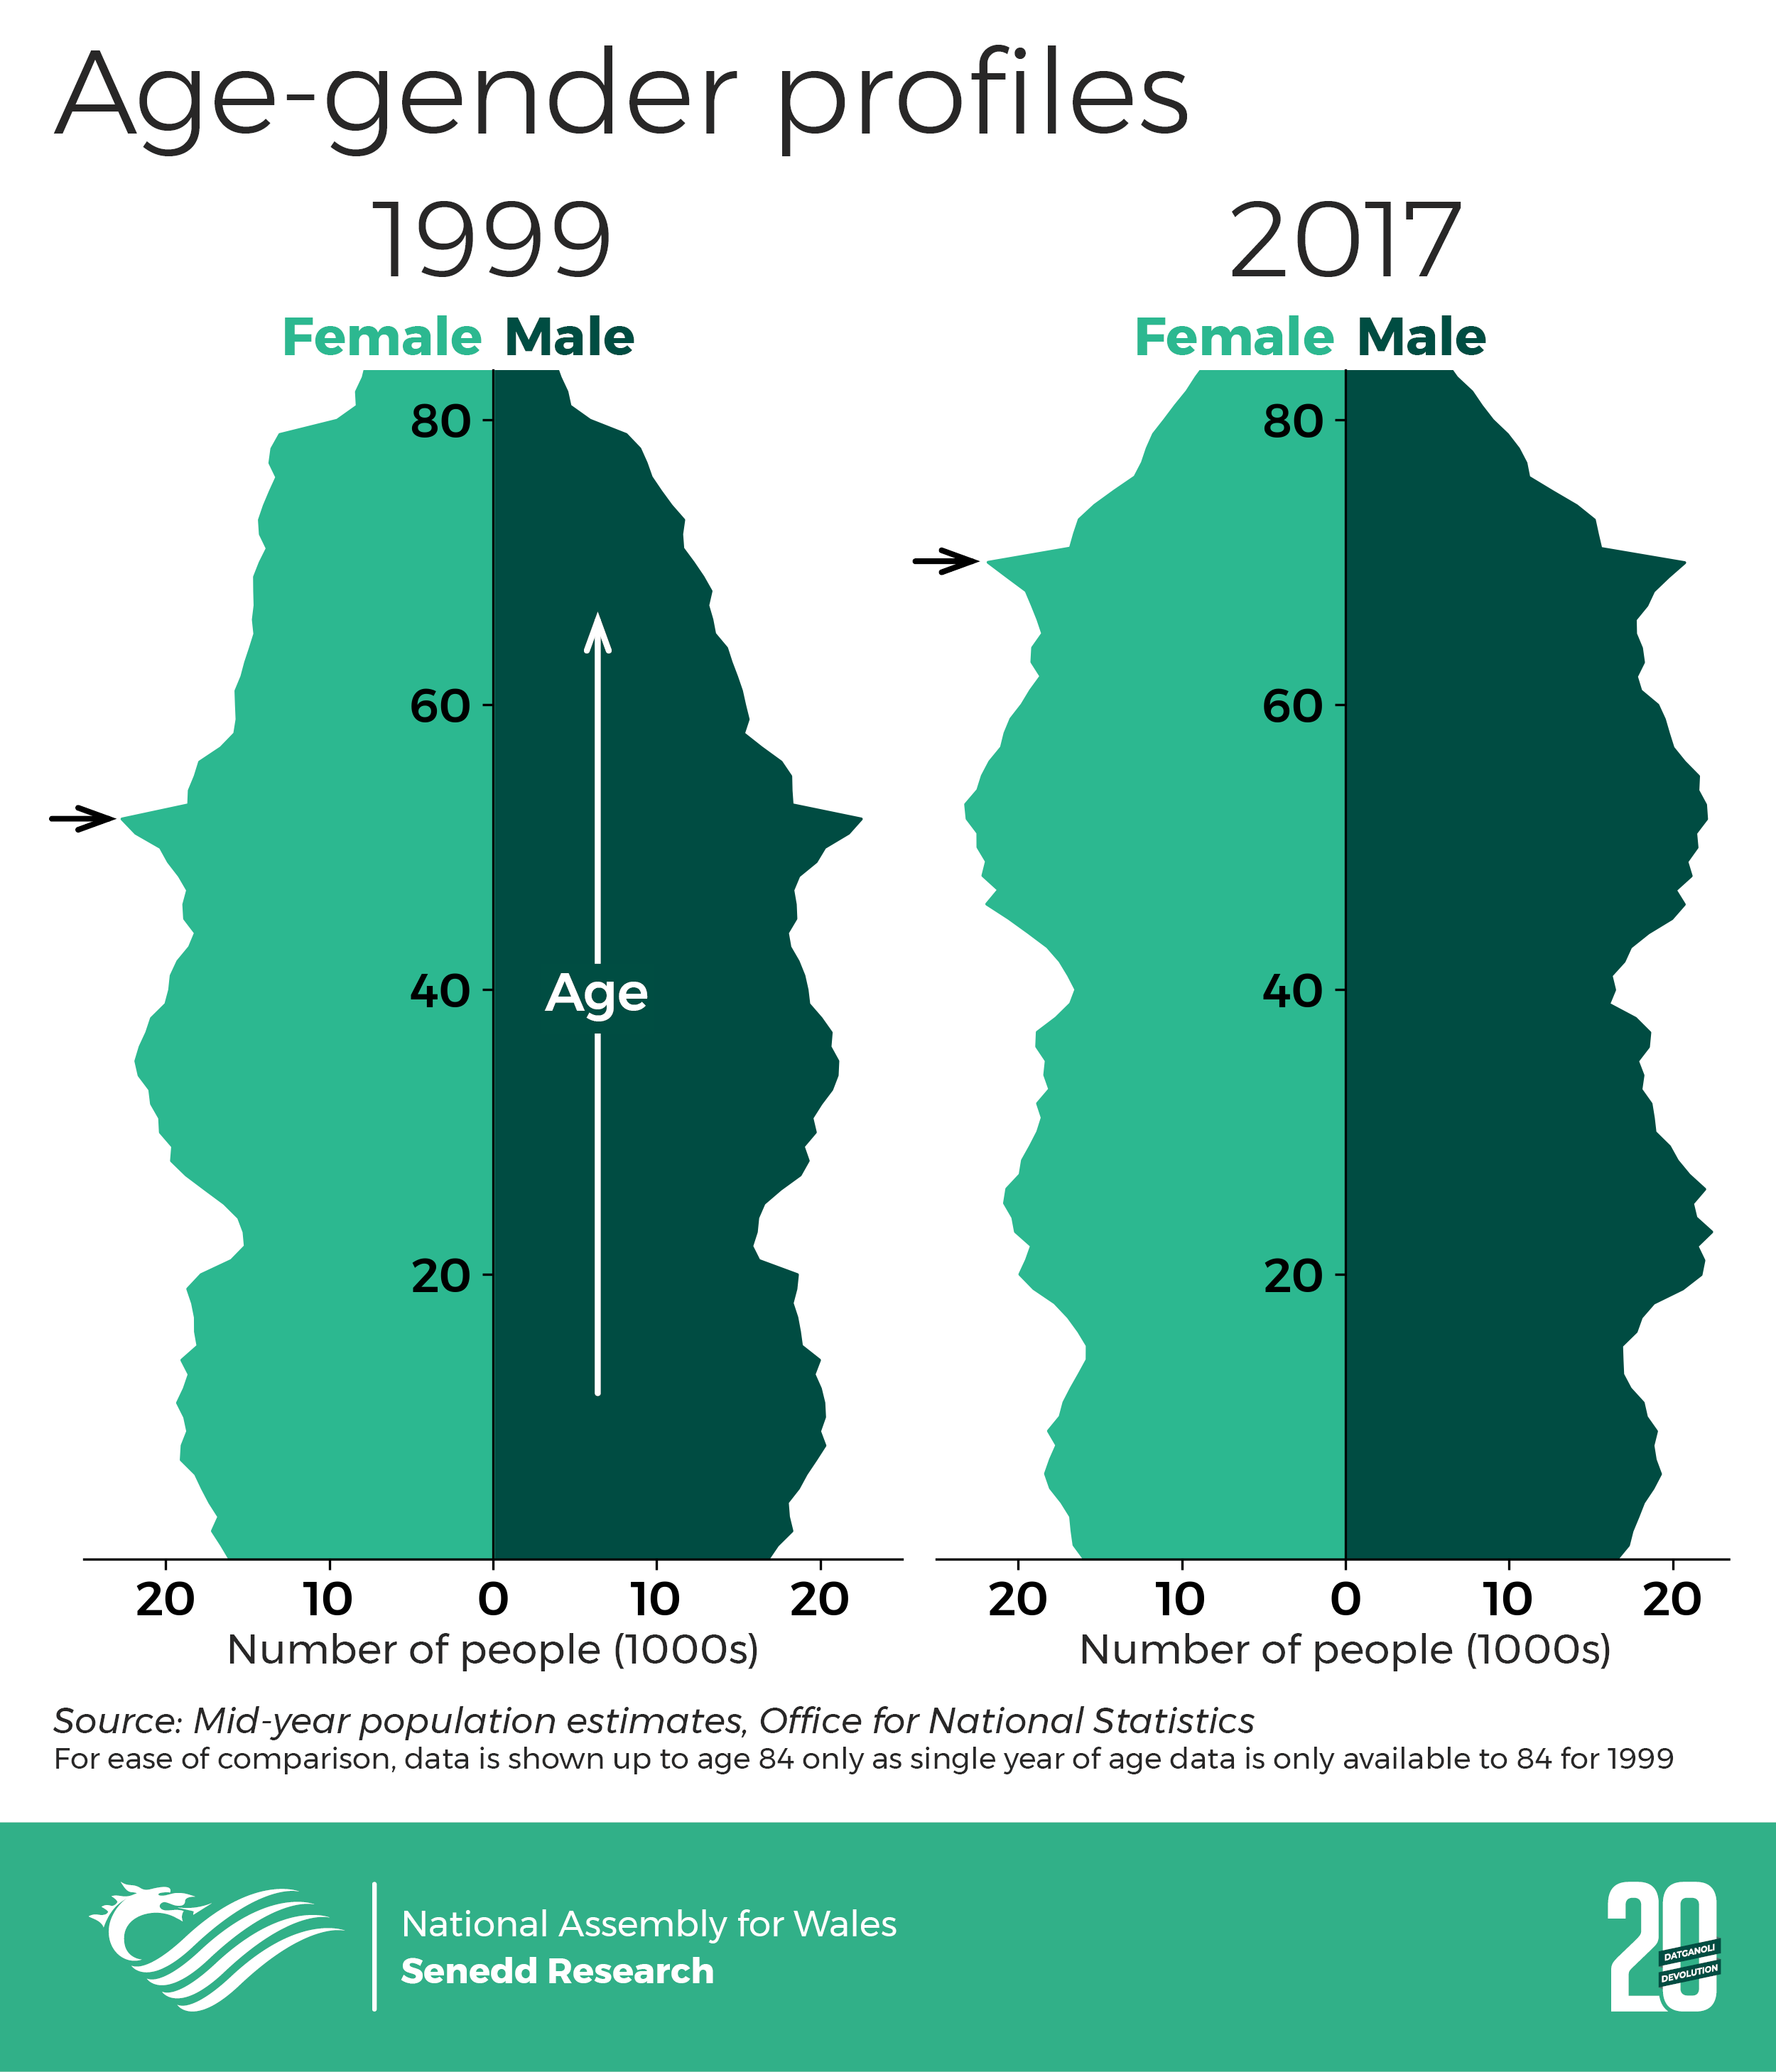
Ageing population: The share of the population under 16 years of age decreased from 20% in 1999 to 18% in 2017. In contrast, the share of the population aged 65 and over increased from 17% in 1999 to 21% in 2017. The share of the population at working age (16-64) increased from 62% to 64% between 1999 and 2008 but returned to 62% by 2017.
Although the differences in the age distributions were small, they are expected to change dramatically in the future, as discussed below.
Population projections
Looking to the next 20 years, the 2016-based population projections produced by ONS provide some insight as to how Wales’ demography may change:
- The population is projected to grow by 3.3% from 2019 to 2039. A projected increase of 103,000 is substantially smaller than the previous 20 years.
- The average age of the population is expected to increase by 2.5 years by 2039, from 42.2 in 2019 to 44.7 in 2039.
- The population of people aged 65 and over is expected to grow by over 30%.
- The working age (16-64) and under-16 populations are expected to decrease by 4.6% and 2.6%, respectively.
The big story in these projections is an expected increase of people aged 65 and over by 30%. An ageing population puts increasing demand on the provision of health and social care, as well as other services, such as home adaptations. As the Assembly’s Finance Committee notes in its inquiry report ’ 'The cost of caring for an ageing population', the increase in the proportion of older people is significant since a longer lifespan means that there are many more people with care and support needs arising from chronic conditions, including dementia and frailty in older age. These extra services will be required at a time when public finances are impacted upon by a reduction in the working age population.
A growing population increases the demand for new homes. It is currently estimated that between 6,700 and 9,700 additional housing units will be required each year between 2018-19 and 2022-23. New homes will need more schools as well as transport services and infrastructure to connect them. There are also implications for natural resources and the environment.
The detail of these claims should be treated carefully as projections only indicate how the population will change if current trends continue. They do not make allowances for a changing economy, new government policies, international relations, housing availability, diseases or epidemics, technological advances or any other societal factors. Projections are increasingly uncertain and increasingly sensitive to the underlying assumptions and input data the further they are carried forwards.
Welsh language
The heat map below shows the percentage of people who said that they can speak Welsh in the 2001 and 2011 Censuses, by area. The data shows that the percentage of people who consider themselves to be Welsh speakers is higher in north and west Wales compared to south east of Wales.
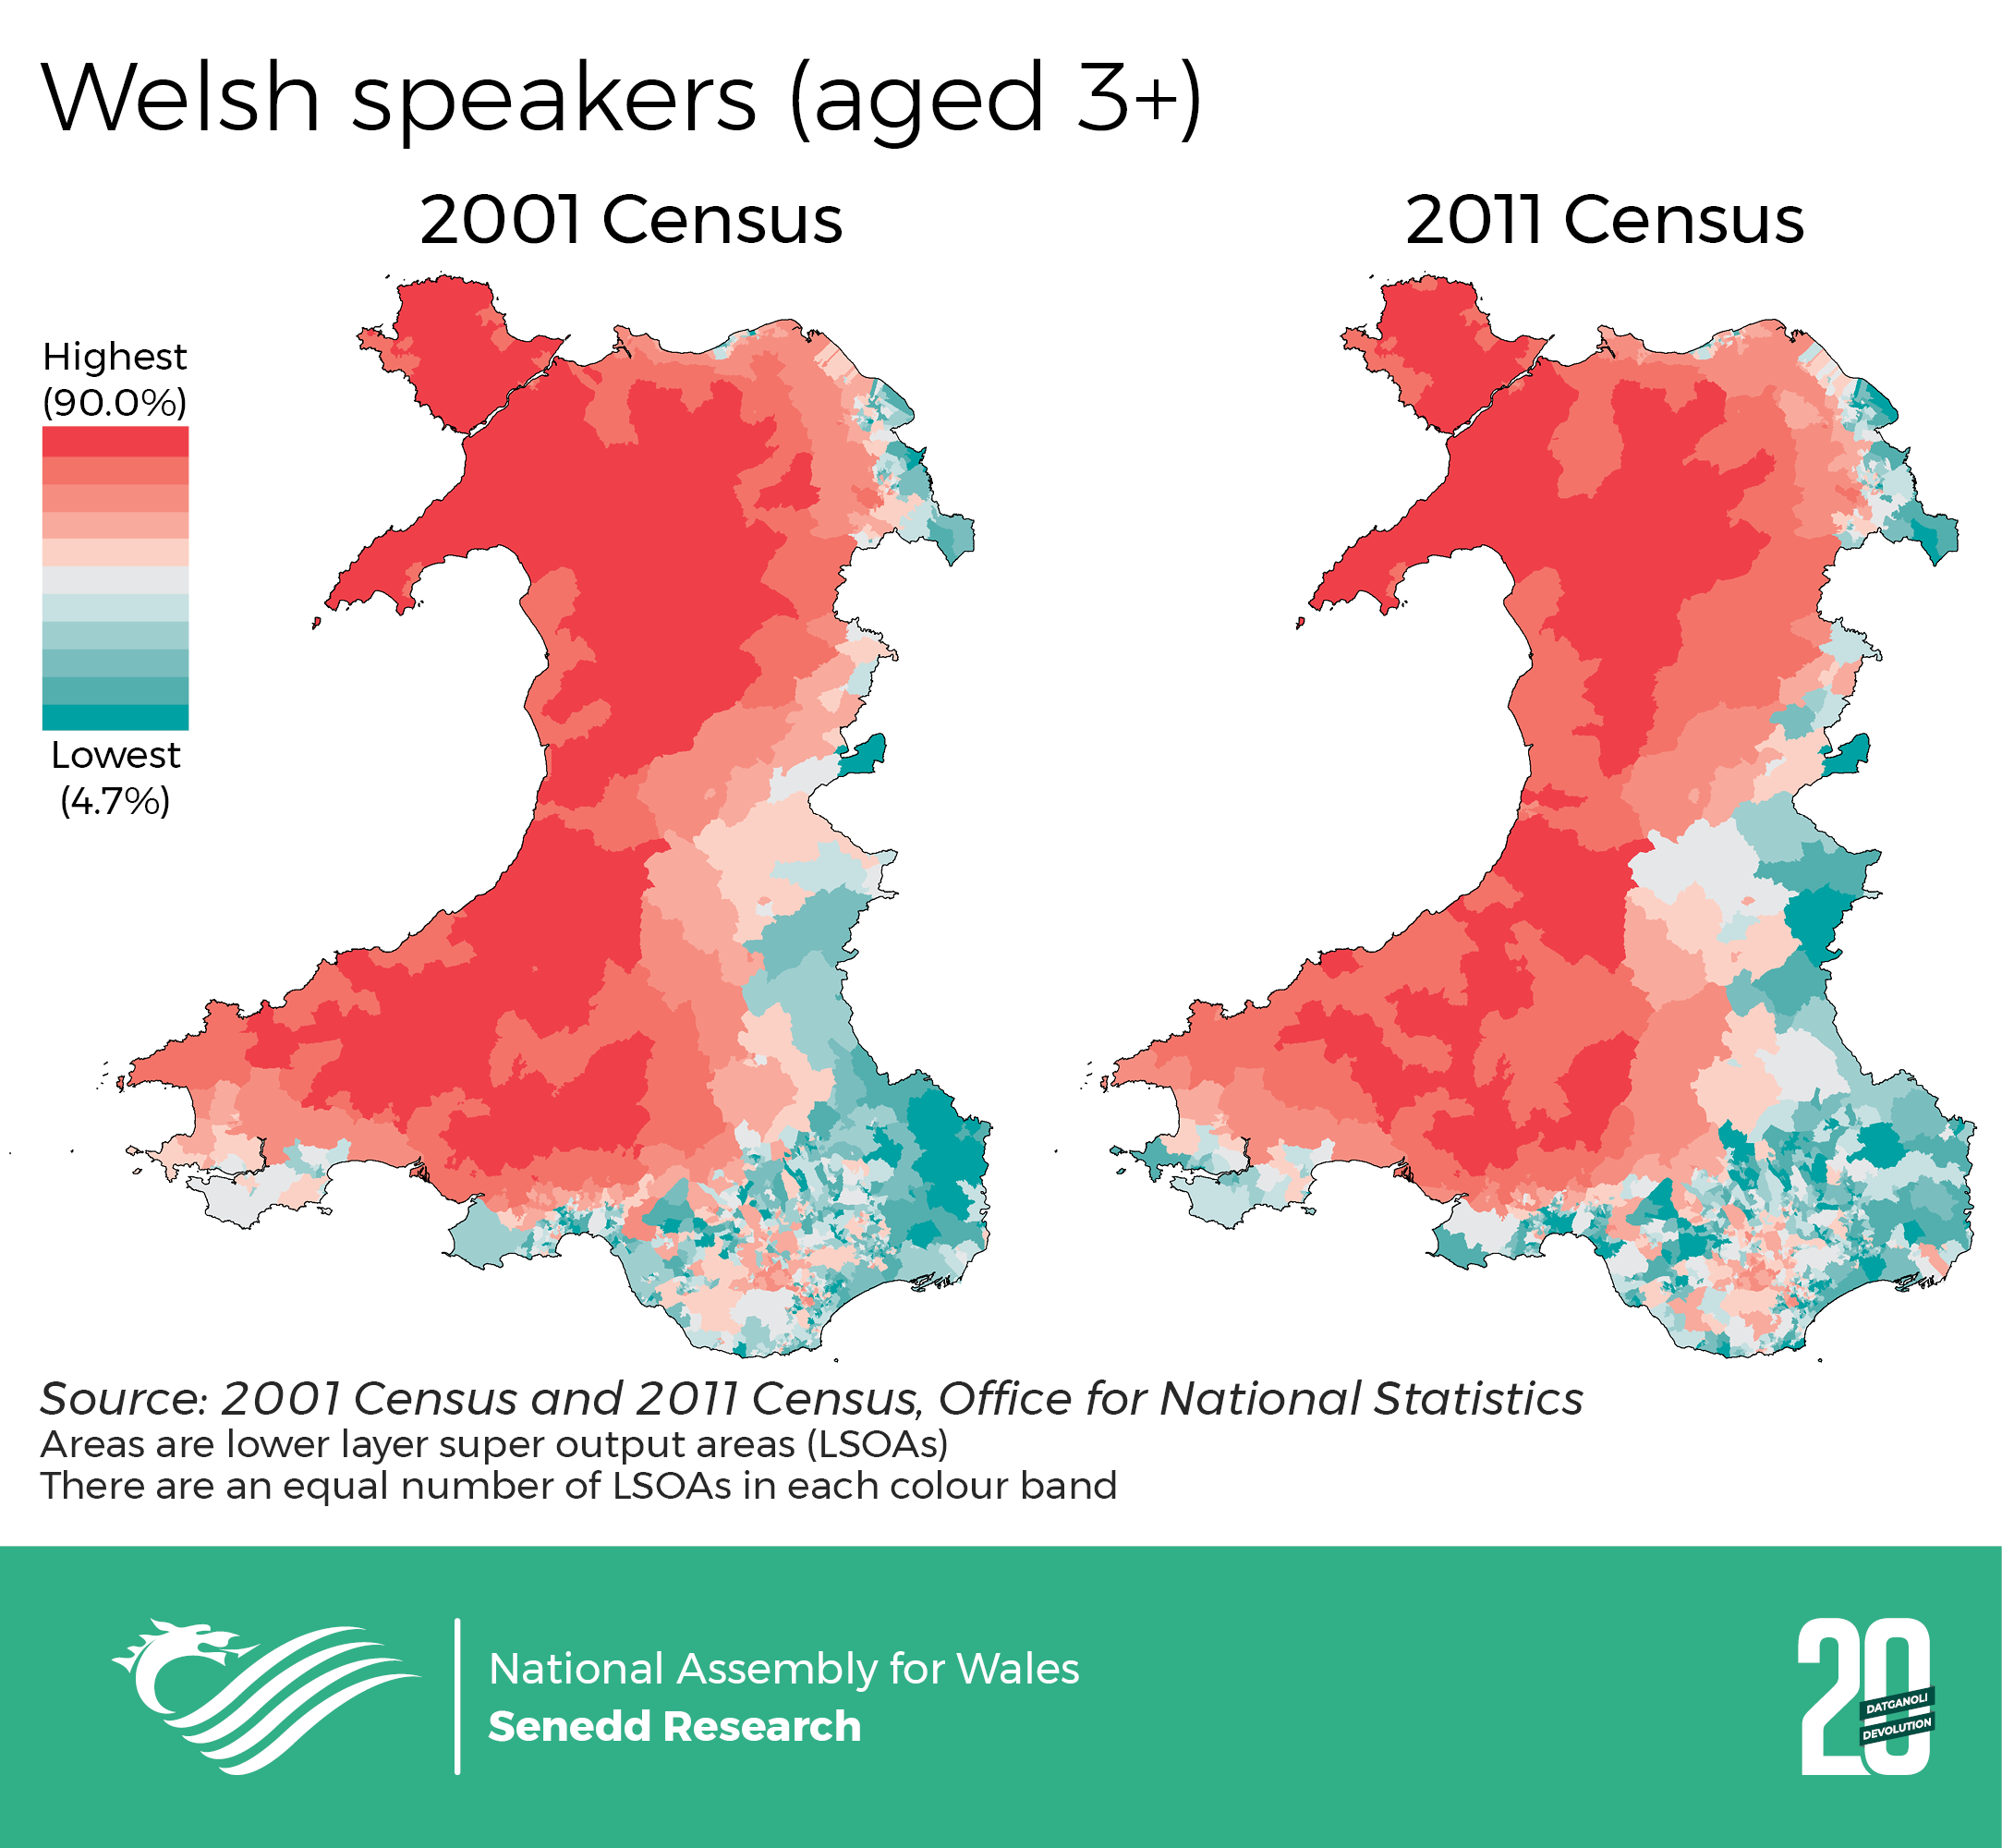
The Census shows a decrease in the percentage of Welsh speakers from 21% (582,000) in 2001 to 19% (562,000) in 2011. The ONS Annual Population Survey (APS) which asks a similar question to a sample of households on Welsh language ability suggests that the number of people reporting they can speak Welsh has risen steadily since 2010, with the latest data in 2018 reporting that over 875,000 people aged 3 and over can speak Welsh.
The Welsh Government has set itself an ambitious target to grow the number of Welsh speakers to one million by 2050 (based on Census results). Its Welsh language strategy, Cymraeg 2050, sets out the key interventions, support and investment required to achieve this goal. These include such things as expanding Welsh-medium early years provision, increasing the proportion of children receiving Welsh-medium education and developing opportunities and promoting its use socially and in the digital sphere.
The next article to be published tomorrow will look at travel.
Article by Senedd Research, National Assembly for Wales
