


Our article published yesterday set out the headline figures for Gross Value Added (GVA), and discussed the limitations of using Welsh GVA to measure the ‘inclusive growth’ that the Welsh Government aims to achieve across Wales. This article focusses on local and regional data from the Office for National Statistics’ (ONS) recent GVA publication. The importance of addressing local and regional economic inequalities across Wales to creating inclusive growth is raised in the Welsh Government’s economic action plan, which states that:
Differences in outcomes between our communities within and between the different regions of Wales are one of the most important structural problems in our economy – acting as a brake on our prosperity and increasing feelings of insecurity and isolation.
While the limitations highlighted in yesterday’s article also apply to using GVA as a measure of economic performance at local and regional levels, GVA performance continues to be scrutinised as a key economic indicator. At a regional level, the City and Growth Deals established by the UK Government place significant emphasis on GVA growth, as both an ambition and a determinant of future levels of funding that may be secured from HM Treasury.
How does GVA per head vary across different areas of Wales?
The local authorities with highest and lowest GVA per head have remained the same since devolution. Cardiff has had the highest GVA per head of any Welsh local authority in each year since 1999, while Blaenau Gwent has had the lowest in each year since 1998.
Between 1998 and 2016, GVA per head as a percentage of the UK average has increased in 4 of the 22 Welsh local authorities, with decreases seen in the other 18.
- The authorities that have seen an increase are Cardiff (3.9 percentage points), Merthyr Tydfil (2.9 percentage points), Carmarthenshire (2.5 percentage points) and Rhondda Cynon Taf (1.5 percentage points).
- Seven local authorities saw a decrease of at least 5 percentage points over this period. The three that saw the largest decreases were Monmouthshire (-12.1 percentage points) Powys (-9.9 percentage points) and the Vale of Glamorgan (-5.4 percentage points).
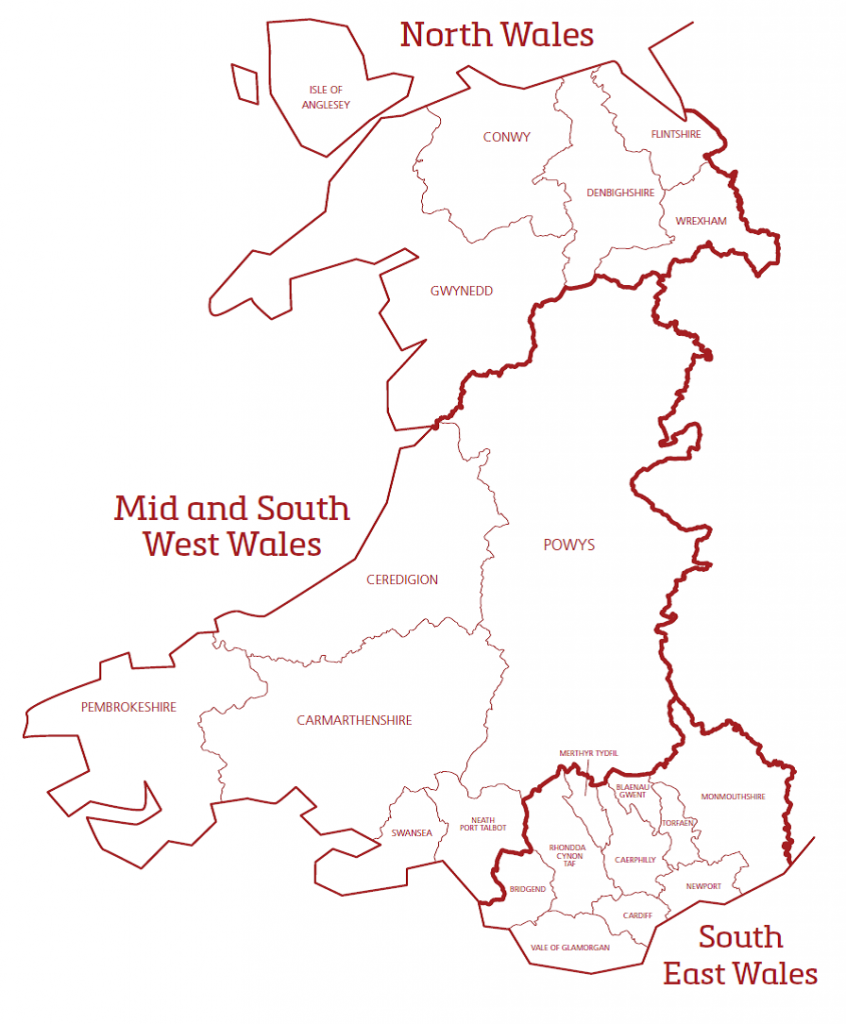
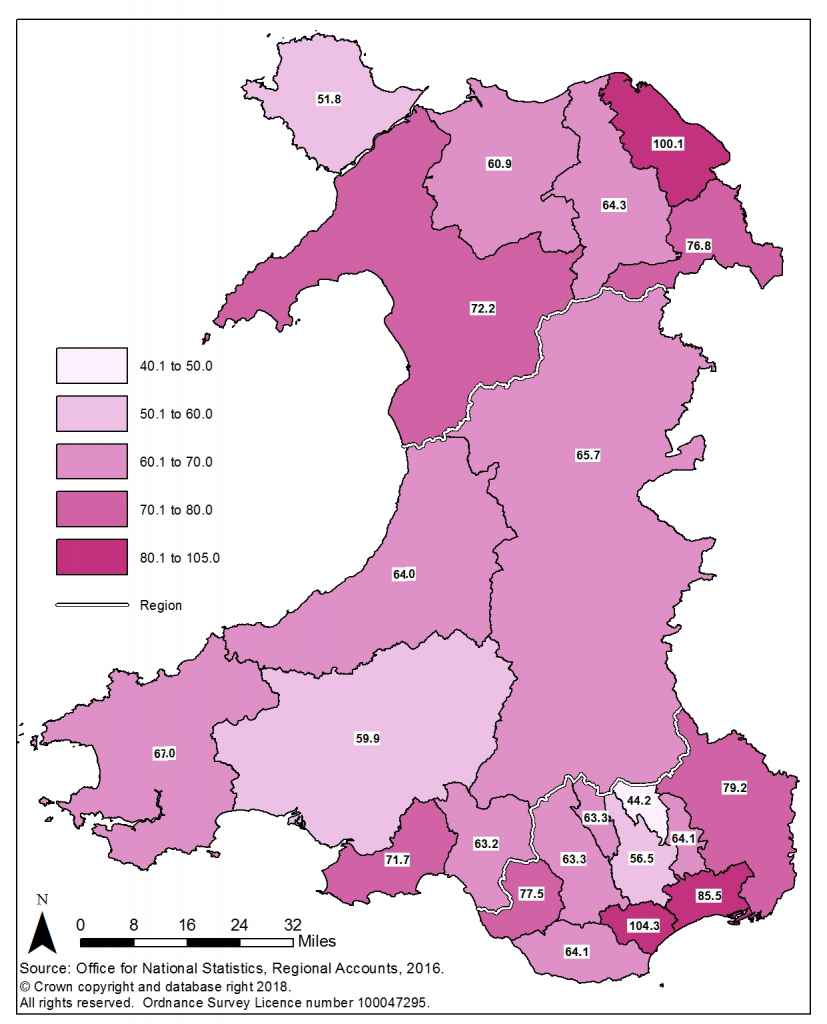
The map below shows the differences in GVA per head as a percentage of the UK average between the local authorities in the Welsh Government’s three economic regions. It can be seen that in 2016:
- GVA per head was above the UK average in just 2 of the 22 Welsh local authorities – Cardiff and Flintshire.
- Four of the five local authorities with the highest GVA per head are in South East Wales (Cardiff, Newport, Monmouthshire and Bridgend), although it is also the case that two of the five authorities with the lowest GVA per head are located in the south east (Blaenau Gwent and Caerphilly).
- The remaining authority of the five with largest GVA per head in Wales is Flintshire. Its GVA per head as a percentage of the UK average is almost 25 percentage points higher than any other local authority in North Wales. The Isle of Anglesey and Conwy were amongst the five local authorities with the lowest GVA per head.
- No local authority in Mid and South West Wales had GVA per head of above 72% of the UK average in 2016. Of the five local authorities in Wales with the highest GVA per head, none are in Mid and South Wales, while Carmarthenshire is the only authority in this region to be included in the five authorities with the lowest GVA per head.
It is worth being aware that the ONS has set out two factors which limit the usefulness of GVA data for individual local authorities. Commuting impacts on GVA figures, as they are based on where people work rather than where they live. Three to four times as many people commute out from Blaenau Gwent and the Isle of Anglesey as those commuting in, meaning that these people will contribute to the GVA of other areas. Age distribution also distorts GVA per head figures, as the proportion of working people will be affected by this. The effects of these distortions will be particularly pronounced when looking at smaller areas such as local authorities.
What action is the Welsh Government taking to address regional economic inequalities?
The Welsh Government’s economic action plan commits to establishing a regionally focussed model of economic development to pursue inclusive growth and address regional disparities in wealth and opportunity across Wales. Key facets of this include:
- Working with partners to develop a robust and clear regional governance model.
- Using a regional approach to respond to the challenges and opportunities that are faced by individual regions. For example, in South East Wales the regional approach will integrate the City Deal and Valleys Taskforce with other Welsh Government policy interventions such as the Targeted Regeneration Investment.
- Appointing three Chief Regional Officers to work across their region to deliver growth.
- As part of the regional focus, helping rural businesses diversify, and to take advantage of supply chains.
- Encouraging regional collaboration for the development of a Mid Wales Growth Deal proposal.
The Welsh Government intends that benefits from this approach will include joined up economic development planning; stronger local and regional supply chains; better integrated transport; strategic planning on issues including housing, land use and skills; and stronger cross border economic and transport collaboration.
The Federation of Small Businesses Wales (FSB Wales) and the Bevan Foundation have both welcomed this regional focus, however both would like to see further action on different aspects.
FSB Wales believes that allowing regions to identify their own priorities based on the needs of business will be key, and would like further action on rural economies through the creation of a Rural Challenge Fund to attract new ideas for economic development in rural areas.
The Bevan Foundation states that ‘re-regionalisation’ of policy is welcome but will not address regional imbalances on its own, and calls for a firm steer from the Welsh Government that it expects the South East region to grow the Heads of the Valleys and the Mid and South West Wales region to support rural Powys. They also highlight the need for the Welsh Government to develop specific measures to deliver ‘better jobs, closer to home’ across all parts of Wales, and specific targets for geographical areas.
Article by Gareth Thomas and Sam Jones, National Assembly for Wales Research Service
Source for map showing economic regions of Wales: Welsh Government, Prosperity For All: Economic Action Plan