


Following the Welsh Government outline draft Budget 2018-19 (released on Tuesday 3 October 2017) the Cabinet Secretary for Finance and Local Government has today published the Provisional Local Government Settlement 2018-19, this outlines funding for each of Wales’ twenty-two local authorities.
The total provisional settlement for 2018-19 is £4.2 billion, which is a decrease of £19.1 million (0.5%) when compared to the adjusted figures for the previous year. The Cabinet Secretary has also provided an indication of the funding for 2019-20, which is outlined as a further reduction of 1.5%.
Cardiff is the only local authority to receive an increase in funding this year (of 0.2%). All other local authorities will receive a reduction in funding, six local authorities will receive the maximum reduction of 1%.
The full breakdown of percentage change in funding by local authority is outlined in the below infographic. 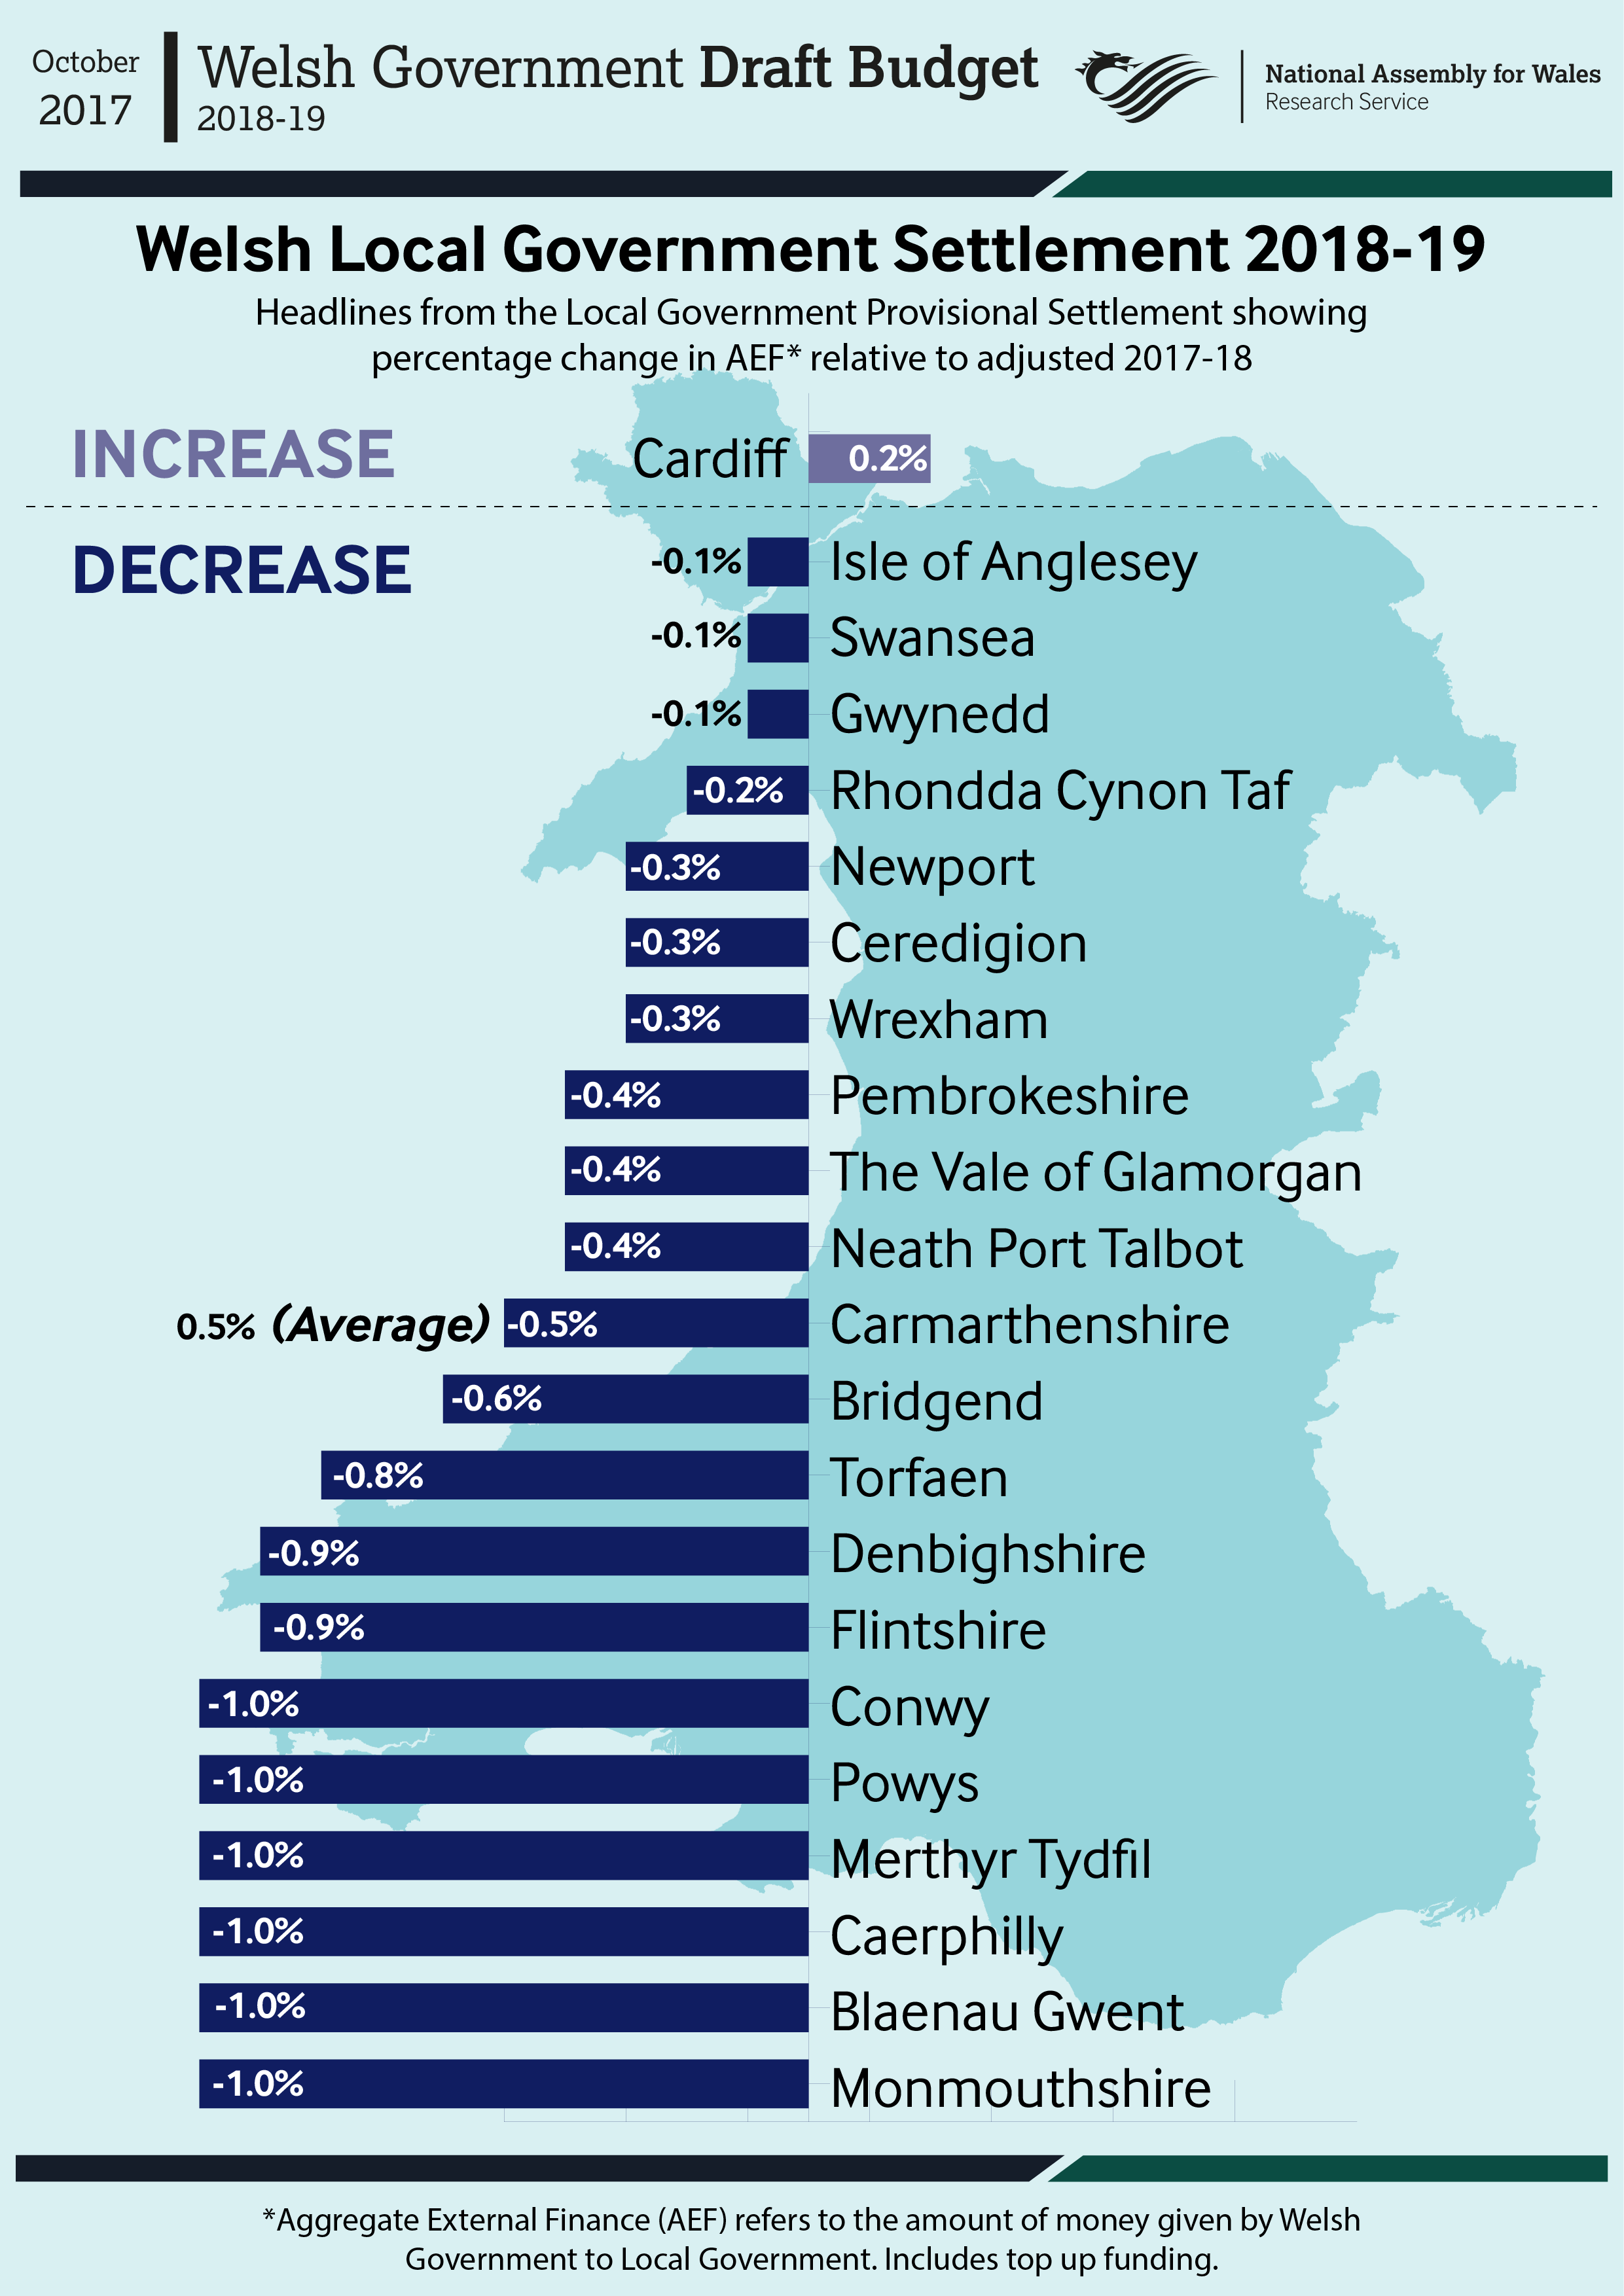 Last year, the Welsh Government implemented a funding floor that meant no authority would experience a decrease of more than 0.5%. This year, the funding floor ensured no authority would experience a decrease of more than 1%. The top-up funding, totalling £1.8 million, has been allocated to the six local authorities below:
- Blaenau Gwent: £890,000
- Conwy: £365,000
- Monmouthshire: £238,000
- Powys: £145,000
- Caerphilly: £107,000
- Merthyr Tydfil: £27,000
General Capital Funding for local authorities in 2018-19 is £143 million, this is the same level as 2017-18.
The Cabinet Secretary’s statement accompanying the settlement also confirms that the Council Tax Reduction Scheme (CTRS) for 2018-19 will be maintained at £244 million.
The Cabinet Secretary’s letter to local authorities, the Local Government Finance Report 2018-19 and the Local Government Revenue and Capital Settlement 2018-19 (Provisional): All Wales – Tables, can be found on the Welsh Government website.
We have produced the interactive map below to show two things:
- the percentage change in local government funding from 2017-18 to 2018-19 (Orange = Positive) (Dark blue to light blue = Biggest decrease to smallest decrease)
- the amount each local authority will have per head of population (Dark pink to light pink = most funding per head to least funding per head)
You can navigate the map to see how each local authority compare against each other, and click on each layer to see the total funding each local authority has in 2018-19.
Article by Owen Holzinger and David Millett, National Assembly for Wales Research Service