
Over the last few months, the Office for National Statistics (ONS) has published data at local authority level for the first time for two measures of economic output and prosperity, Gross Value Added (GVA) and Gross Disposable Household Income (GDHI). These datasets are scrutinised as key indicators of economic performance when data for Wales is released, so what can they tell us at a local level? And what limits might there be on the insight we can draw from the figures?
What are the key conclusions that can be drawn from the data?
The Research Service has produced interactive maps that can be used to explore performance of local authorities across Wales from 1997 to 2015 using these measures, showing GVA and GDHI per head, and also as a percentage of the UK average. The maps below show GVA and GDHI per head as a percentage of the UK average in 2015.
As you can see, Cardiff, Flintshire and Newport had the highest GVA and GDHI per head of the Welsh local authorities during 2015, however for both measures no Welsh local authority was above the UK average. Blaenau Gwent and Caerphilly were in the three authorities with the lowest GVA and GDHI per head across Wales in 2015.
Some local authorities perform better on one measure than another. For example, Gwynedd has much higher GVA per head than Anglesey, however when you look at GDHI this is reversed. This is partly due to GVA being a workplace-based measure of economic prosperity and GDHI being a residence-based measure. Given that around 7,500 people commute from Anglesey to Gwynedd compared to 1,700 the other way this means that workers from Anglesey contribute to the GVA of Gwynedd.
Figure 1: GVA as a % of UK average in 2015 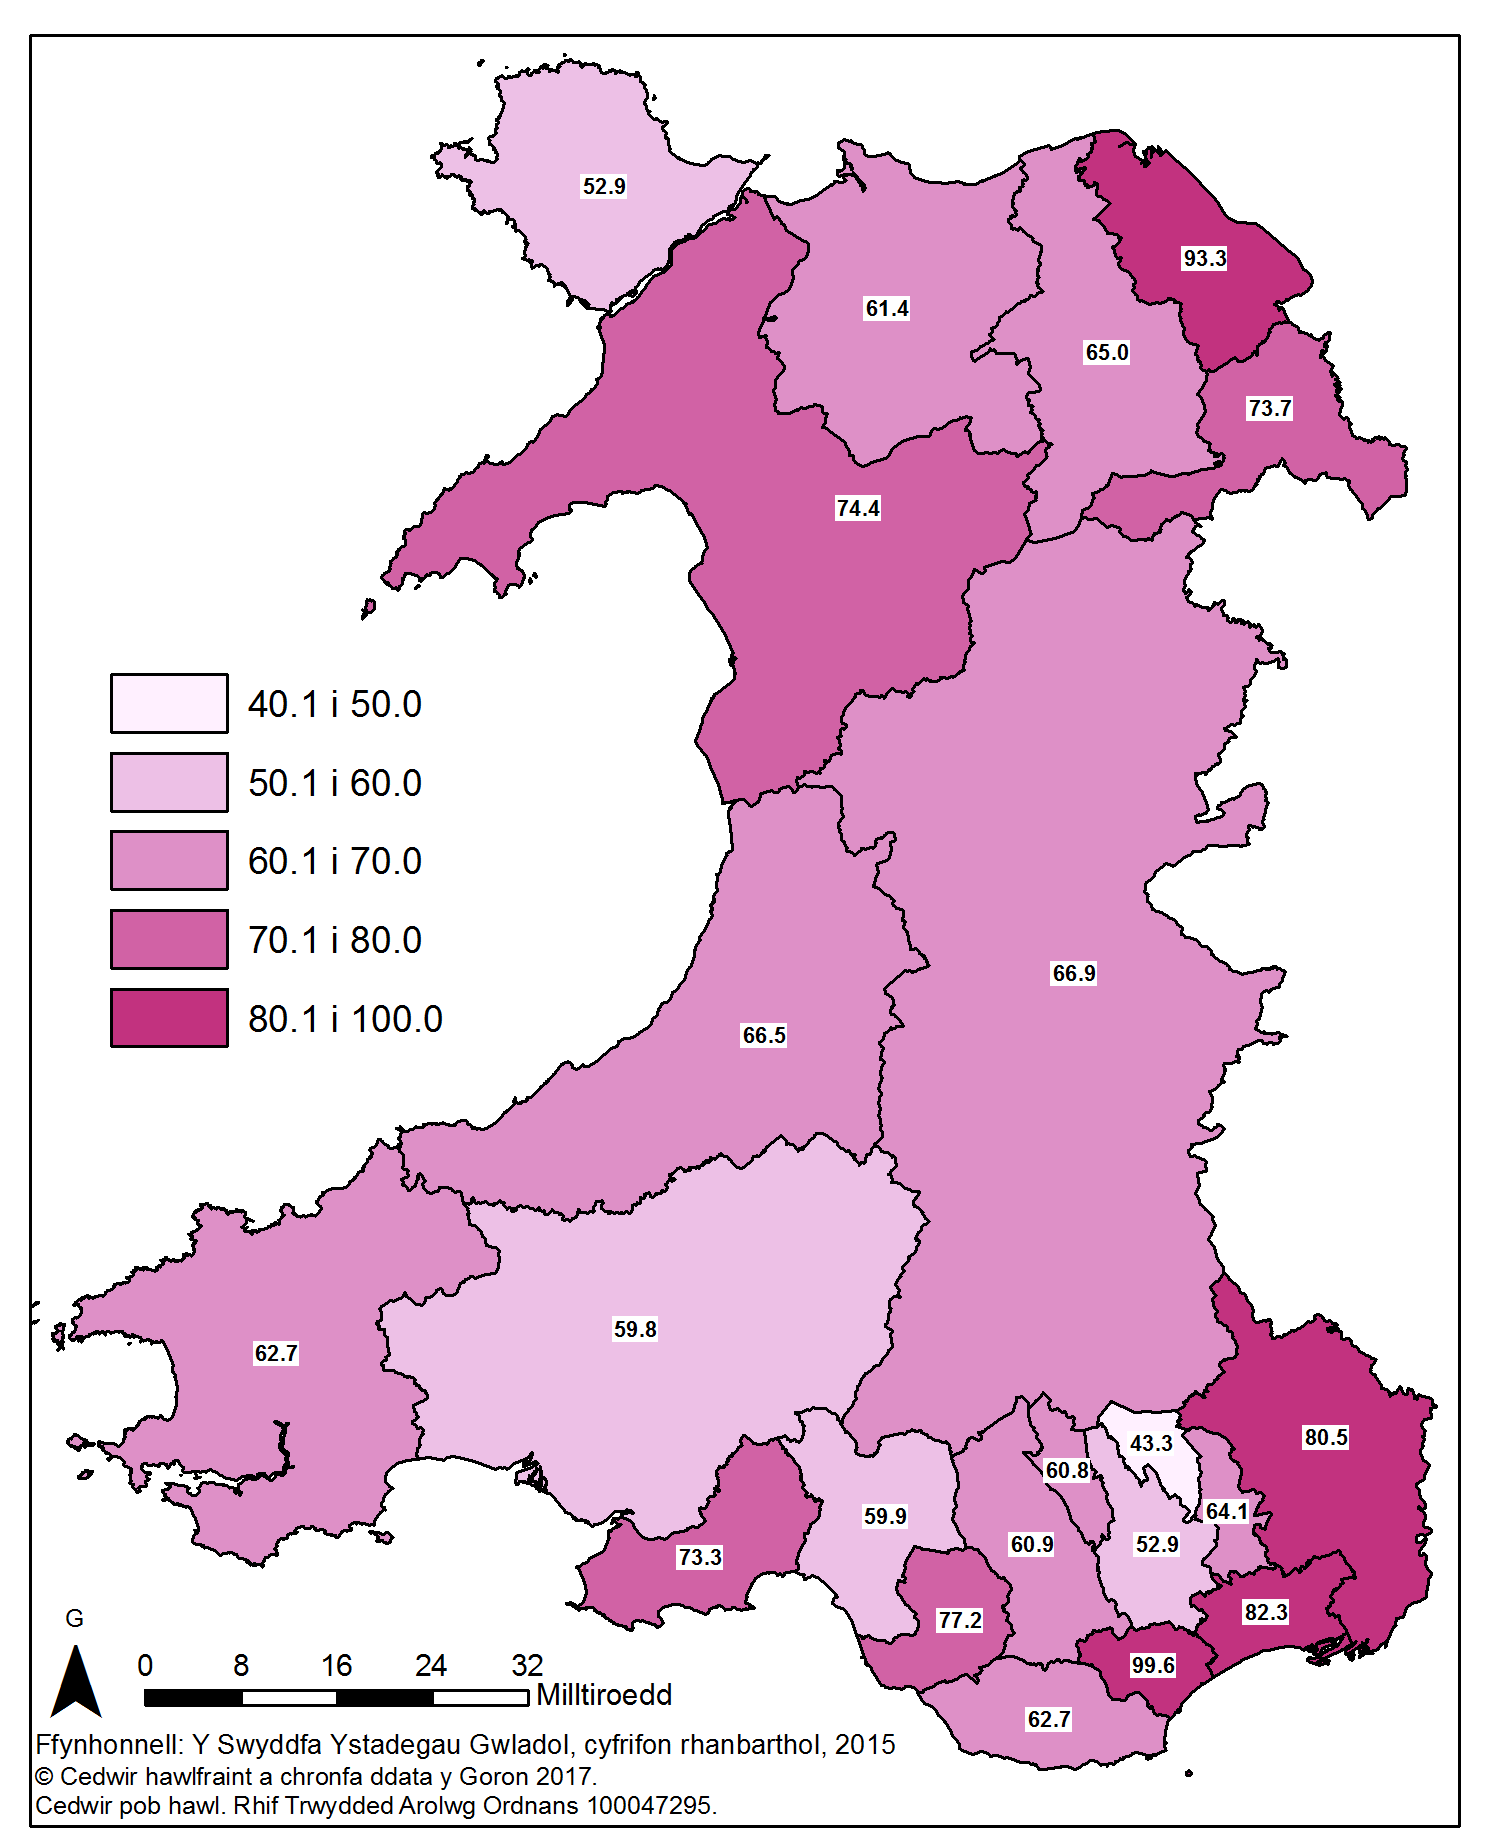 Looking at the GVA data in greater detail, it can be seen that:
- Between 1997 and 2015, 3 of the 22 Welsh local authorities saw an improvement in their GVA per head as a percentage of the UK average – Carmarthenshire, Merthyr Tydfil and Rhondda Cynon Taf.
- Of the 19 authorities who saw a decrease in their GVA per head as a percentage of the UK average over this period, Flintshire, Pembrokeshire and Powys saw the largest percentage point decreases.
- Since 1999, Cardiff has had the highest GVA per head of any Welsh local authority. However, since 2007 this has decreased from 116% of the UK average to 99.6% in 2015.
For each year since 1997, Blaenau Gwent has had the lowest GVA per head of any Welsh local authority, and for all years except 2012 has had the lowest GVA of any local authority across the UK. However, as a caveat to this data it is worth being aware that since 2008 there have been two to three times as many people commuting out of Blaenau Gwent as commuting in, which will mean that residents of Blaenau Gwent contribute to the GVA of other local authorities.
Figure 2: GDHI as a % of UK average in 2015 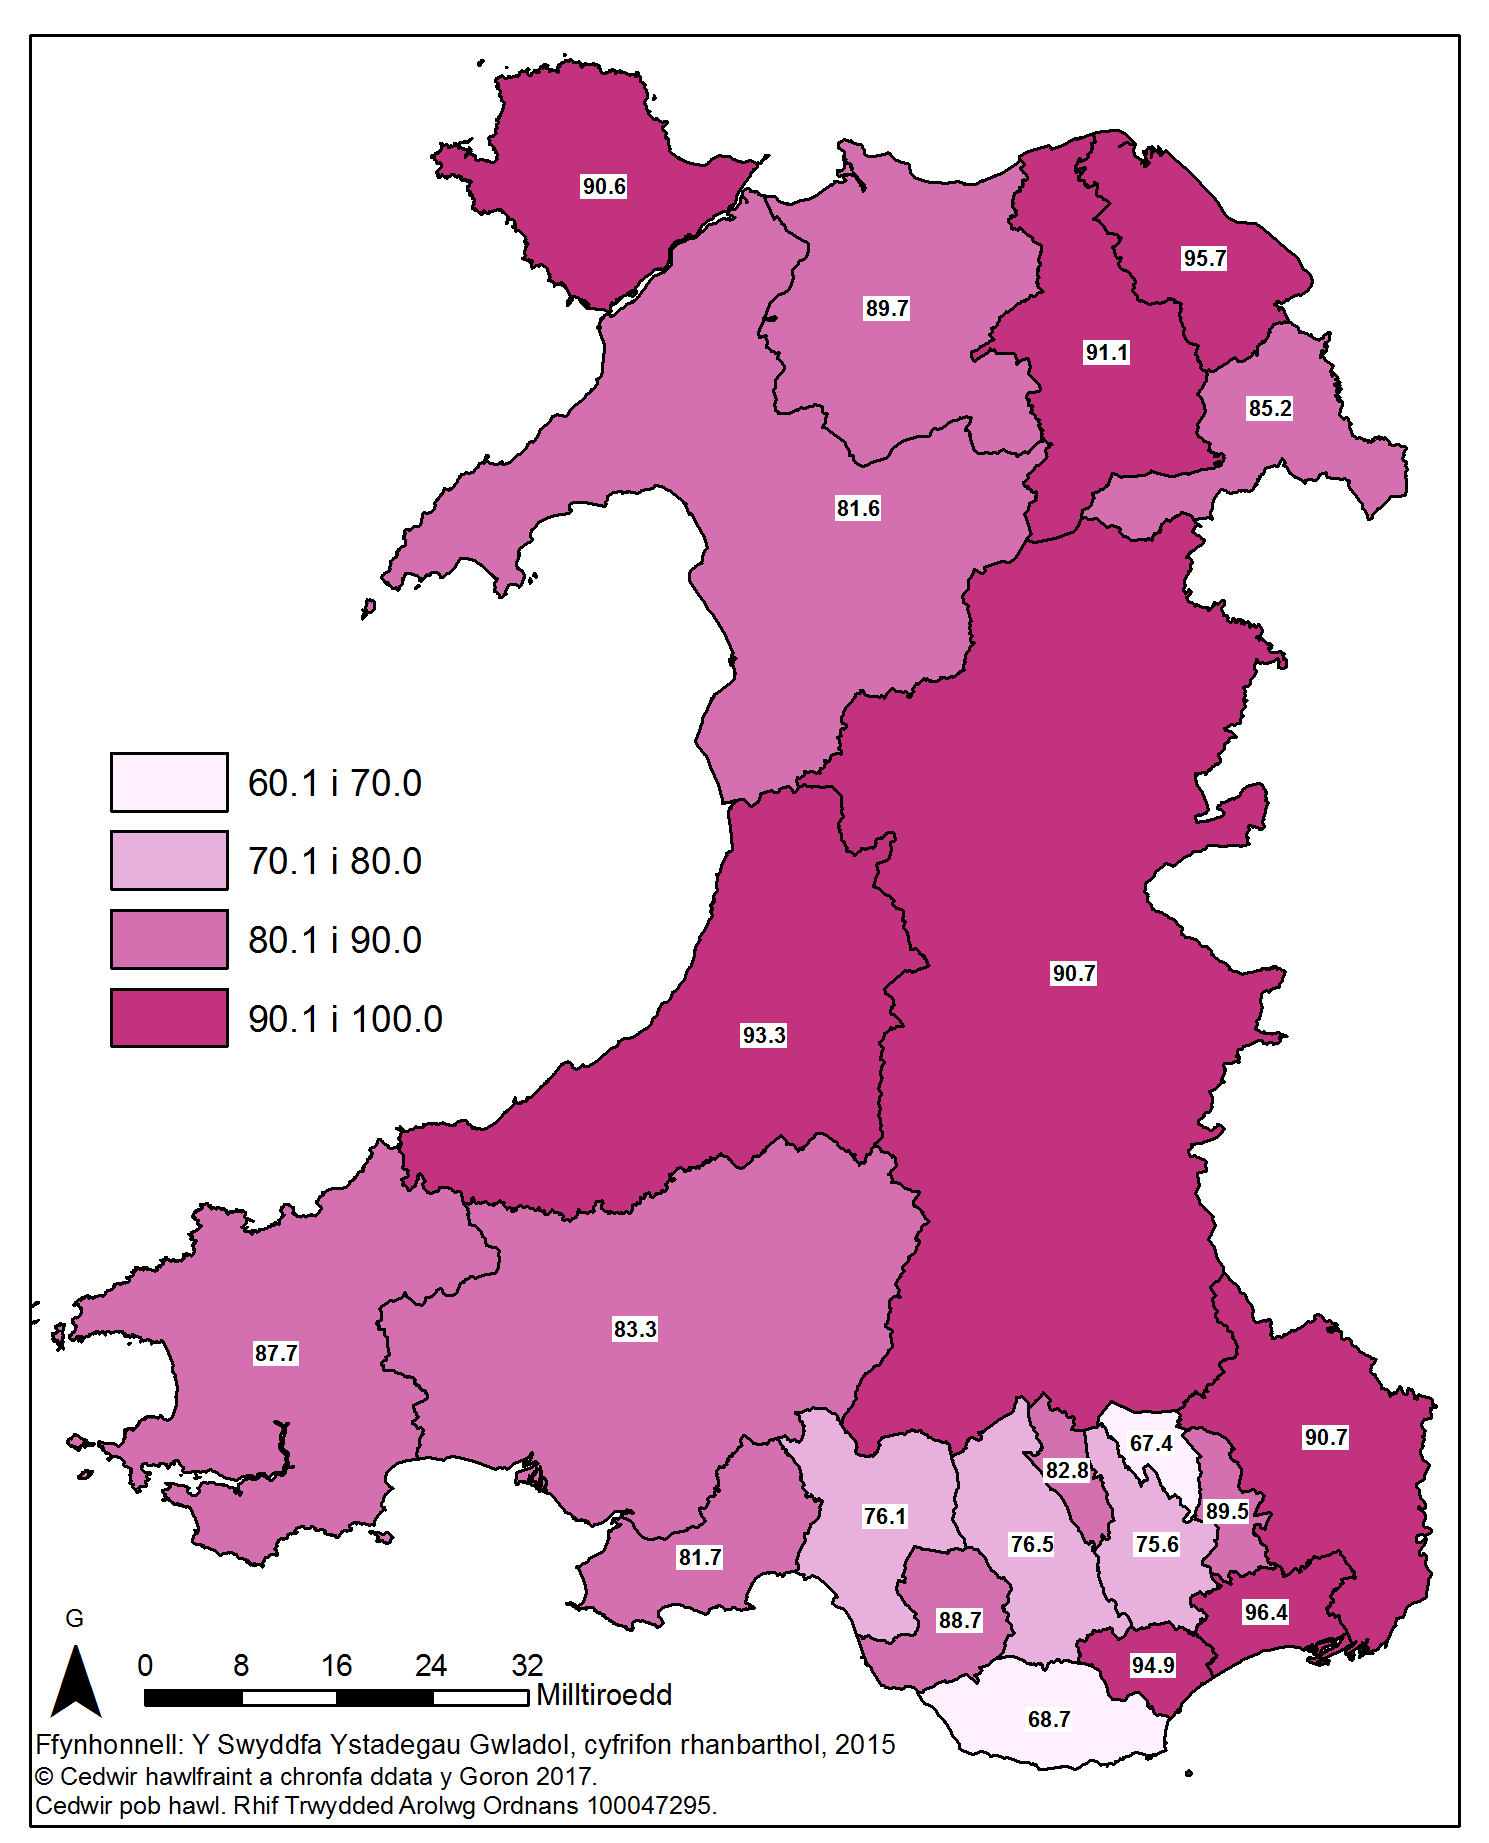 Looking in-depth at the GDHI data, it can be seen that:
- Between 1997 and 2015, 8 of the 22 Welsh local authorities saw an improvement in their GDHI per head as a percentage of the UK average, with Powys seeing the largest percentage point increase and Bridgend seeing the largest percentage point decrease.
- From 1998 to 2014, Cardiff had the highest GDHI per head of the Welsh local authorities, and up to 2011 this was regularly above the UK average. However, this has seen a percentage point decrease in recent years, and in 2015 Newport and Flintshire both had higher GDHI per head.
- For 13 of the 19 years of data between 1997 and 2015, Blaenau Gwent has had the lowest GDHI per head of any Welsh local authority, including the last three years for which data is available.
What are the limitations of the data, and what additional indicators might we need to look at to get a full picture of local economic performance?
While the data provides some useful insights into economic performance at a local level, there are a number of limitations in using them.
GVA and GDHI data for local authorities are not classed as National Statistics in the same way that data for larger areas are. This means that they have not been assessed as meeting quality standards that comply with the Code of Practice for Official Statistics. This means that, while the datasets have been published to meet user need, some caution should be used when drawing conclusions from them.
As mentioned above, commuting between areas rears its head as a limitation of GVA data. This has an effect both when looking at GVA of both large and small geographical areas in Wales. The ONS also highlights that age distribution distorts GVA per head figures, as the proportion of working people will be affected by this. The effects of these distortions will be particularly pronounced when looking at smaller areas such as local authorities.
Wider concerns around simply using one indicator as a measure of economic success or otherwise have been raised by the Welsh Government, who consider that a range of indicators are needed to measure economic performance, including employment rates, earnings and the poverty rate as well as GVA and GDHI. In terms of GVA, they state that this is linked to city size, and that this negatively impacts Wales as it has the lowest proportion of its economy in large cities of the nations and regions in Great Britain.
Looking outside government, a number of organisations have called for different measures to be used to look at economic growth. For example, the Joseph Rowntree Foundation and Bevan Foundation have called for inclusive growth to be implemented to benefit people across all communities and places. This approach considers measures of low earnings, worklessness, housing supply/affordability and educational attainment as well as indicators of economic output, number of businesses and of higher-skilled occupations.
Article by Gareth Thomas and Sam Jones, National Assembly for Wales Research Service
This post is also available as a print-friendly PDF: How is my local economy performing? (PDF, 341KB)