
As the country grapples with what UK trade will look like after Brexit, there is increasing focus on the current state of play for Welsh trade. A useful resource to help us understand the shape and size of Welsh exports and imports is the Regional Trade Statistics (RTS) published by the HMRC. In these statistics, trade with countries outside the UK is allocated to UK countries and regions.
The Assembly’s Committee on Climate Change, Environment and Rural Affairs has recently completed its Inquiry into the Future of Agriculture and Rural Development Policies in Wales. The inquiry explored the principles that should underpin the new Welsh polices needed to replace those currently set by the European Union.
With the above in mind, this blog explores some of the headline figures for Welsh exports, with a focus on some of the key statistics for the agricultural sector.
How much does Wales export, and where does it go?
The following infographic illustrates some of the key points relating to Welsh exports in 2016.
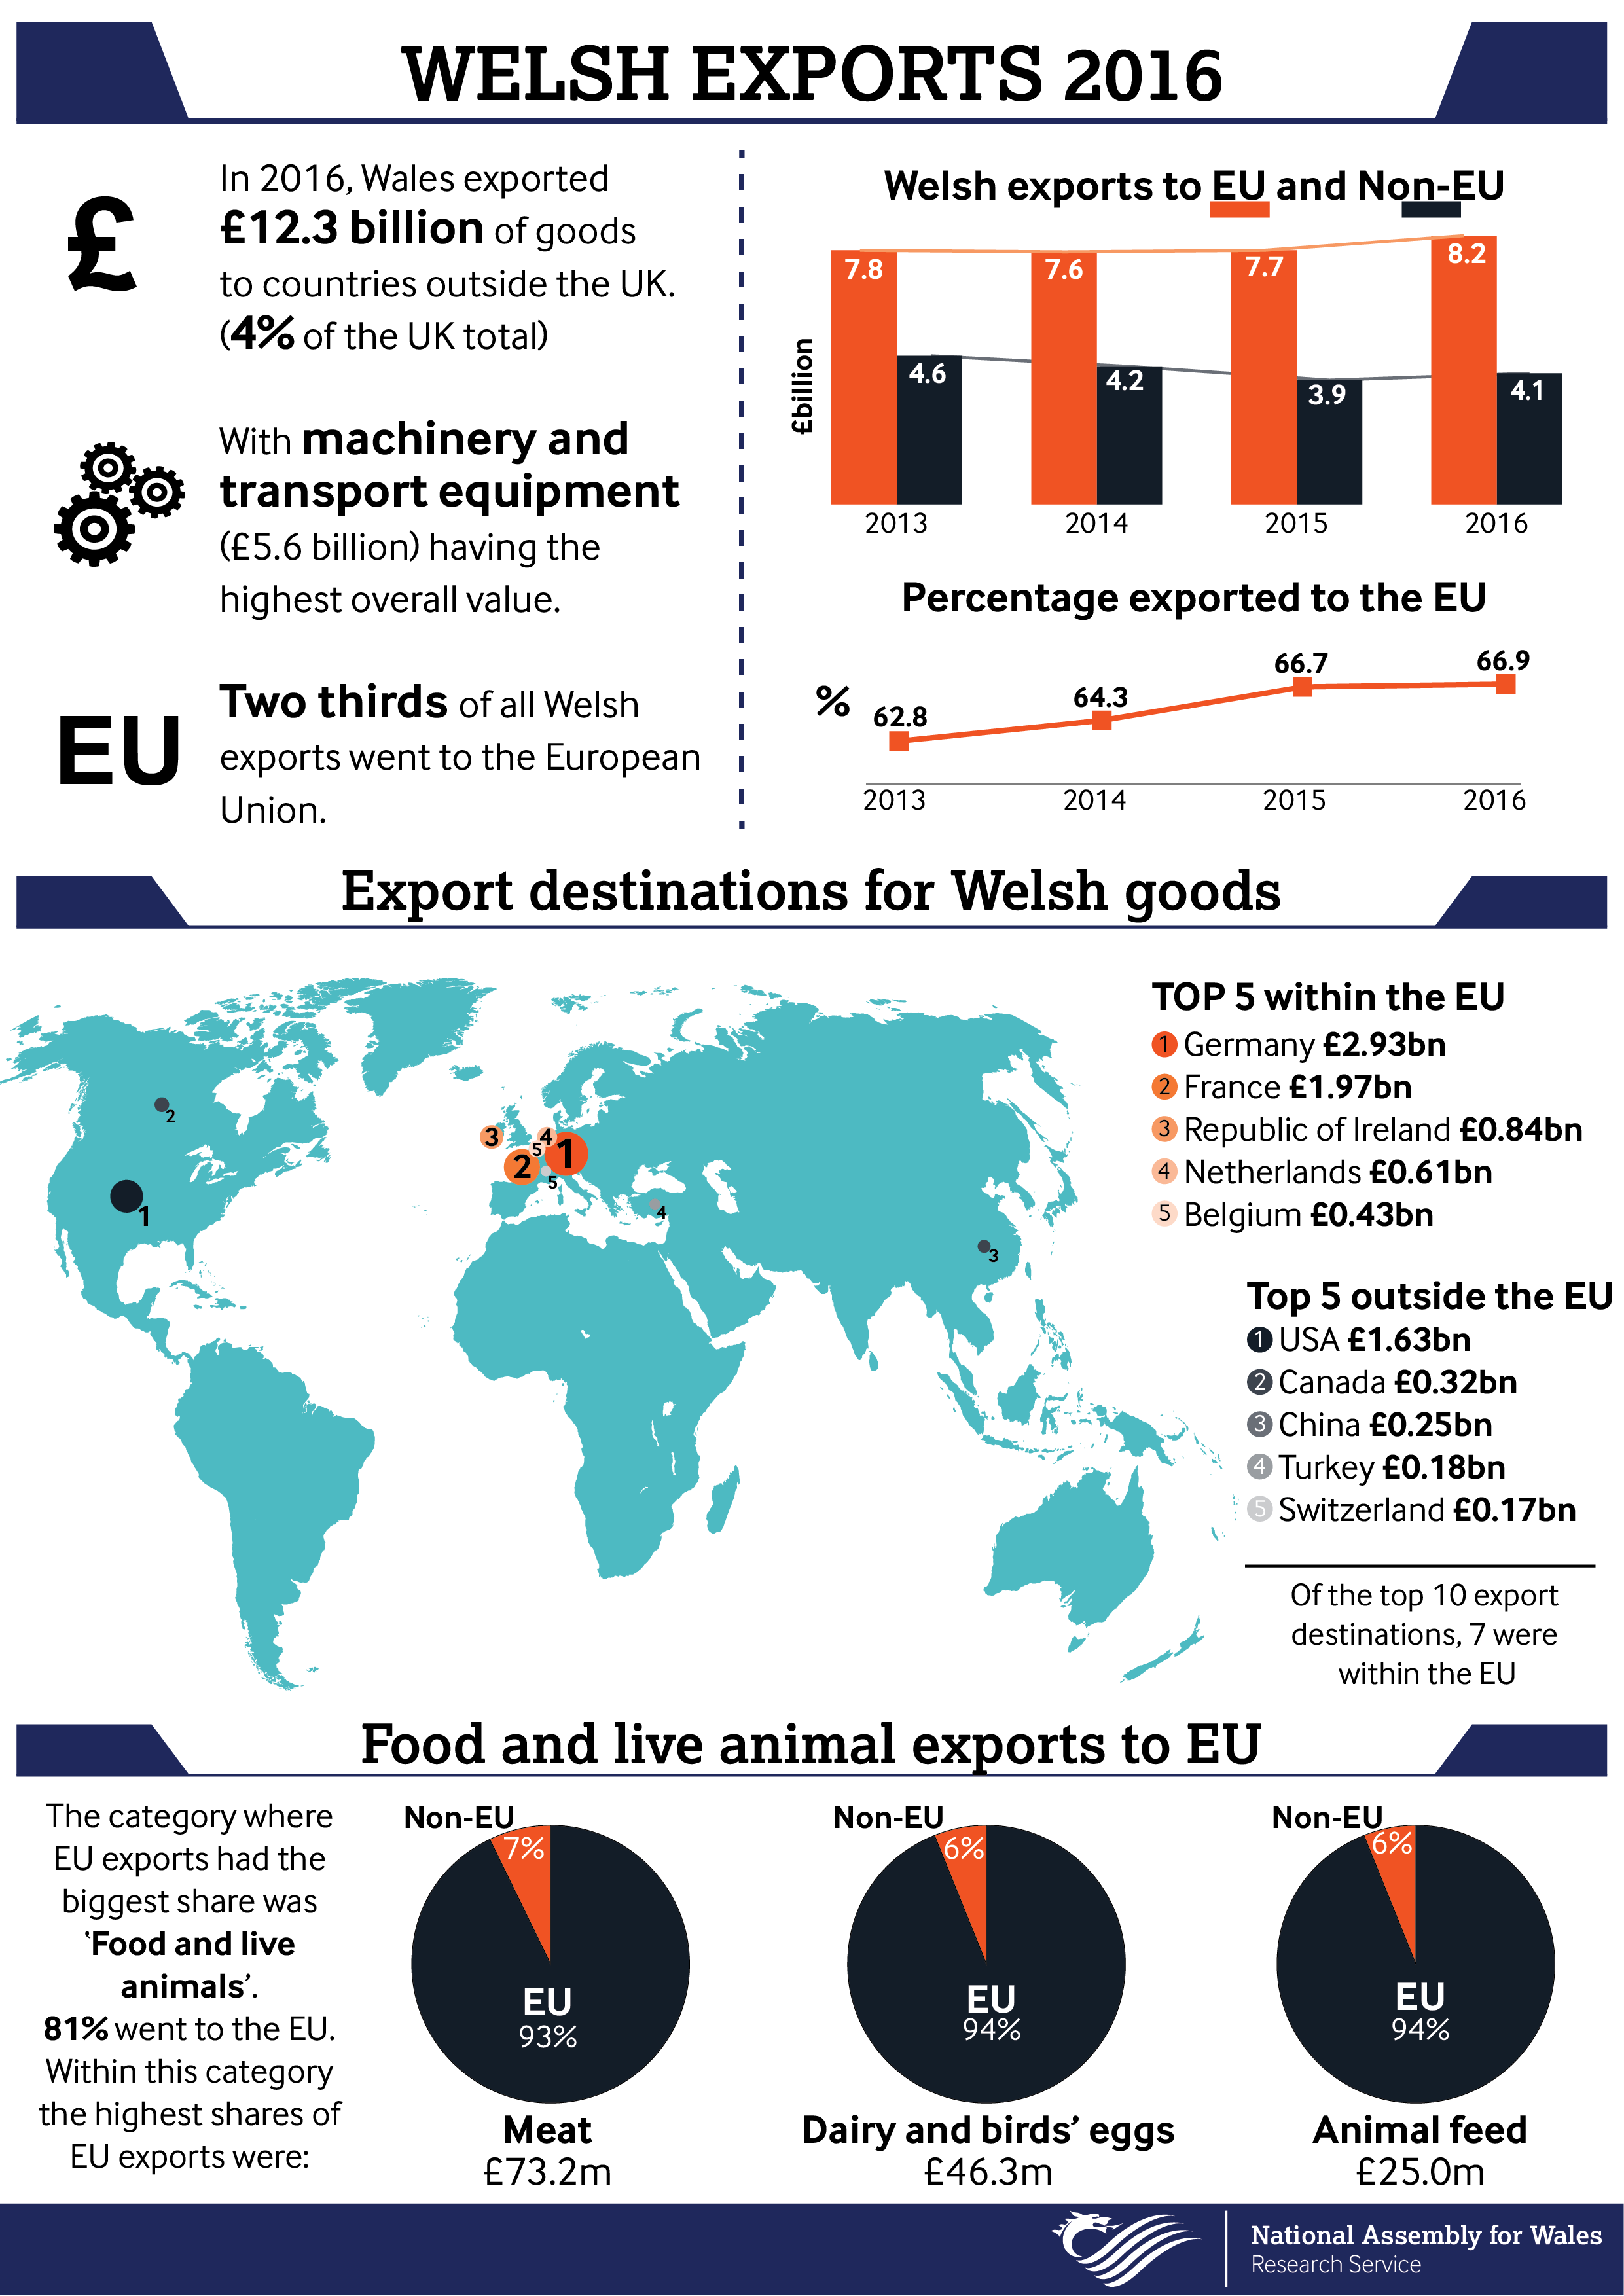
Data is for the year 2016. Trade is expressed in terms of monetary value.
Trade is allocated to regions within the UK according to the RTS methodology, discussed in further detail below.
‘Unallocated – unknown’ includes those goods for which not enough details are known for allocation to a region. ‘Unallocated – known’ includes goods for which the full details are known but it is unrealistic to allocate to a specific region.
The ‘EU’ portion of Welsh exports does not include other regions of the UK, as HMRC statistics are a record of the UK’s trade with countries outside the UK.
The categories are as defined by UN Standard International Trade Classification (SITC) codes. ‘Meat' refers to all types of meat and meat preparation, including both red and white meat.
What about Welsh agriculture?
The export data above highlights the role of EU exports in the agricultural sector. There has been particular interest in the future of Welsh lamb post-Brexit, and speculation over whether a new trade deal with New Zealand will bring in tough competition from New Zealand lamb.
The HMRC’s Regional Trade Statistics are not detailed enough to look at lamb specifically, and they do not include Welsh exports to the rest of the UK. However, Hybu Cig Cymru (HCC) has provided estimates on the destination of Welsh lamb. HCC is the industry-led organisation responsible for the development, marketing and promotion of Welsh red meat.
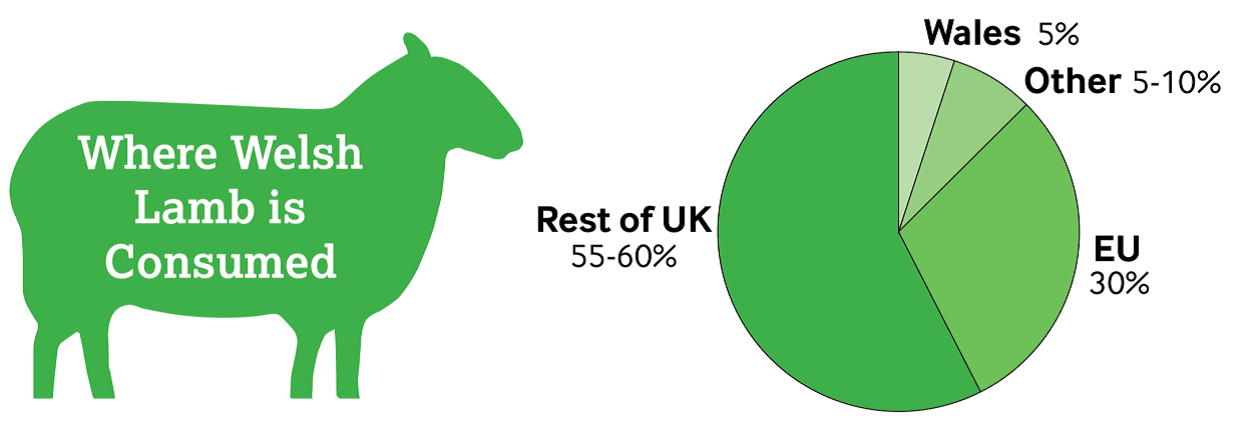
For Welsh lamb exported to the EU, France, Italy, Germany, Spain, the Netherlands, Belgium and Scandinavia are the largest consumers. Exports outside the EU are comparatively small in volume, mainly to Switzerland, Canada, UAE and Hong Kong.
Agriculture is a vital part of many communities in Wales. In 2015, the ‘agriculture, forestry and fishing sector’ accounted for 3% of employment. However, in certain areas, this share was much higher. For example, in Powys, the share was 16%, and in Ceredigion, it was 11%.
How is trade allocated to devolved nations and English regions?
A number of methodological assumptions are made to allocate trade to the devolved nations and English regions. More details on the Regional Trade Statistics methodology can be found on the HMRC website. Two recent methodological changes have affected recently published figures.
These changes may be an important point to bear in mind when using Regional Trade Statistics. It is especially significant when comparing data from different periods or different sources, as apparent trends may not be an accurate reflection of real changes.
The first change entered into force from May 2016 due to legislative changes on the way goods are declared to Customs. It relates to the point at which goods are recorded – either as they enter a customs warehouse (the previous ‘General Trade’ basis), or as they leave (the newly adopted ‘Special Trade’ basis).
A number of other changes brought in from 2016 Q3 include a new way of allocating trade to regions. Under the previous methodology, allocations were based on the location of the Head Office. The new methodology allocates trade based on the proportion of employees within a certain region. This reduces ‘head-office distortion’, where there is a bias towards nations and regions with a high number of company headquarters.
The Welsh Government notes on its website that the change in methodology has had a major impact on Welsh trade statistics. Using the old methodology, 39.2% of Welsh EU exports went to the EU in the four quarters ending in June 2016. Under the new methodology, 67.4% of Welsh exports went to the EU over the same period.
Article by Jeni Spragg, David Millett and Gareth Thomas, National Assembly for Wales Research Service.
The Research Service acknowledges the parliamentary fellowship provided to Jeni Spragg by the Engineering and Physical Sciences Research Council, which enabled this blog post to be completed.
Source: HMRC Regional Trade Statistics
Source: HCC
This post is also available as a print-friendly PDF: Understanding Welsh exports: a look at the latest Regional Trade Statistics (PDF, 330KB)