


Article by Michael Dauncey, National Assembly for Wales Research Service
Next week (Tuesday 23 February 2016), Assembly Members will debate the annual report of Estyn’s Chief Inspector, which provides a summary of inspection outcomes of schools and other education and training settings in academic year 2014/15. This is the first of two articles which aim to inform next week’s plenary debate. The 2014/15 annual report is the first since the new Chief Inspector, Meilyr Rowlands, was appointed in June 2015. New features this year include an online search and filter facility, providing outcome data for all inspections undertaken in 2014/15 as well as throughout the current inspection cycle which began in 2010. In his report, the Chief Inspector refers to the education reforms of recent years, saying they had ‘set sound foundations for education’ in Wales. He reports that: ‘On the whole, progress is being made with these foundations and we are beginning to see the benefits of this groundwork, although more remains to be done.’ Indeed, arguably the main message from the Chief Inspector is the ‘variability in standards’, which he describes as ‘one of the most noticeable features of the Welsh education system’. He reports: ‘Once again this year, there is a marked contrast between the quality of teaching and learning, particularly in our best education providers and in the weakest. This variability is not due primarily to socio-economic factors as some of our best providers are in relatively deprived areas.’ (…) ‘… the gap between the schools that are doing well and those that are not is still too wide. The variability in quality of education that exists between providers, and their varied capacity for leadership, self-improvement and partnership working, needs to be addressed.’ The contrast in performance is most visible amongst secondary schools. One in six secondary schools were judged as Excellent overall, whilst about the same proportion were judged to be Unsatisfactory. The Chief Inspector says this represents a ‘polarisation in inspection outcomes’ in secondary schools, according to the sample inspected in 2014/15, as the proportion of both those judged Excellent or Unsatisfactory rose from the previous year. Mr Rowlands has already answered questions about his report from the Children, Young People and Education Committee on 27 January 2016 (PDF 461KB). He offered some explanation to the Committee why standards tended to vary to the extremes more in secondary schools than primary schools: ‘Why is that polarisation greater in secondary than in primary? I think it’s not just a function of inspection, as you see it in lots of other indicators. So, for example, the gap between boys’ performance and girls’ performance seems to get wider as children get older. The gap between disadvantaged pupils and their peers also seems to get wider as they get older. There seems to be a cumulative effect that starts, maybe, in primary school, but gets wider in secondary. I think the other factor in terms of this polarisation, possibly, is that secondary schools are bigger and more complex organisations than primary schools.’ What does Estyn actually look at when it inspects schools and other settings? Estyn uses a Common Inspection Framework, which was introduced at the start of the current cycle in September 2010. This framework consists of three key questions on ‘how good’ are outcomes, provision, and leadership and management. Estyn then forms two overall judgements about the current performance and prospects for improvement of each setting according to a four point scale: Excellent; Good; Adequate; Unsatisfactory. There are two tables at the end of this article. Table 1 presents the results of the two overall judgements of settings within school-age and early years sectors in 2014/15. Table 2 shows these results on a cumulative basis throughout the current cycle to date. What has happened to inspection outcomes? Estyn’s online data provides for analysis of trends in inspection outcomes between individual years
- The proportion of primary schools inspected during the year that were judged Excellent or Good decreased from 70% in 2012/13 to 62% in 2013/14, before rising to 67% in 2014/15.
- The proportion of secondary schools inspected during the year that were judged Excellent or Good increased from 45% in 2012/13 to 53% in 2013/14, before falling to 41% in 2014/15.
However, the Chief Inspector urges caution in reaching conclusions simply based on annual samples. In his report, he highlights that none of the changes listed above were statistically significant. On 27 January 2016, he told the Children, Young People and Education Committee: ‘..all those changes were, in fact, within those error bars [used to measures ranges of statistical significance]. So, what that means is that, in reality, you can be pretty sure that, overall, there hasn’t been a lot of change in either primary or secondary.’ So whilst there has not been much significant change in the proportion of schools which are Good or better, there has been an increase in the proportion of these that are Excellent in the secondary sector. Similarly, there has not been a significant change in the proportion that are Adequate at best, but there has been a rise in the proportion of secondary schools that are Unsatisfactory. Hence, the polarisation which the Chief Inspector talks about. Meilyr Rowlands puts this down, above all else, to the level of consistency within schools and the quality of leadership. As he told the Committee: ‘So, ultimately, we have little doubt that what makes the biggest difference in terms of what makes good provision in a school is good leadership.’ We will post another article tomorrow, looking at particular sectors and what Estyn has to say about performance against the Welsh Government’s education priorities. Table 1: Inspection Outcomes by Sector 2014/15 [caption id="attachment_5730" align="alignnone" width="1489"]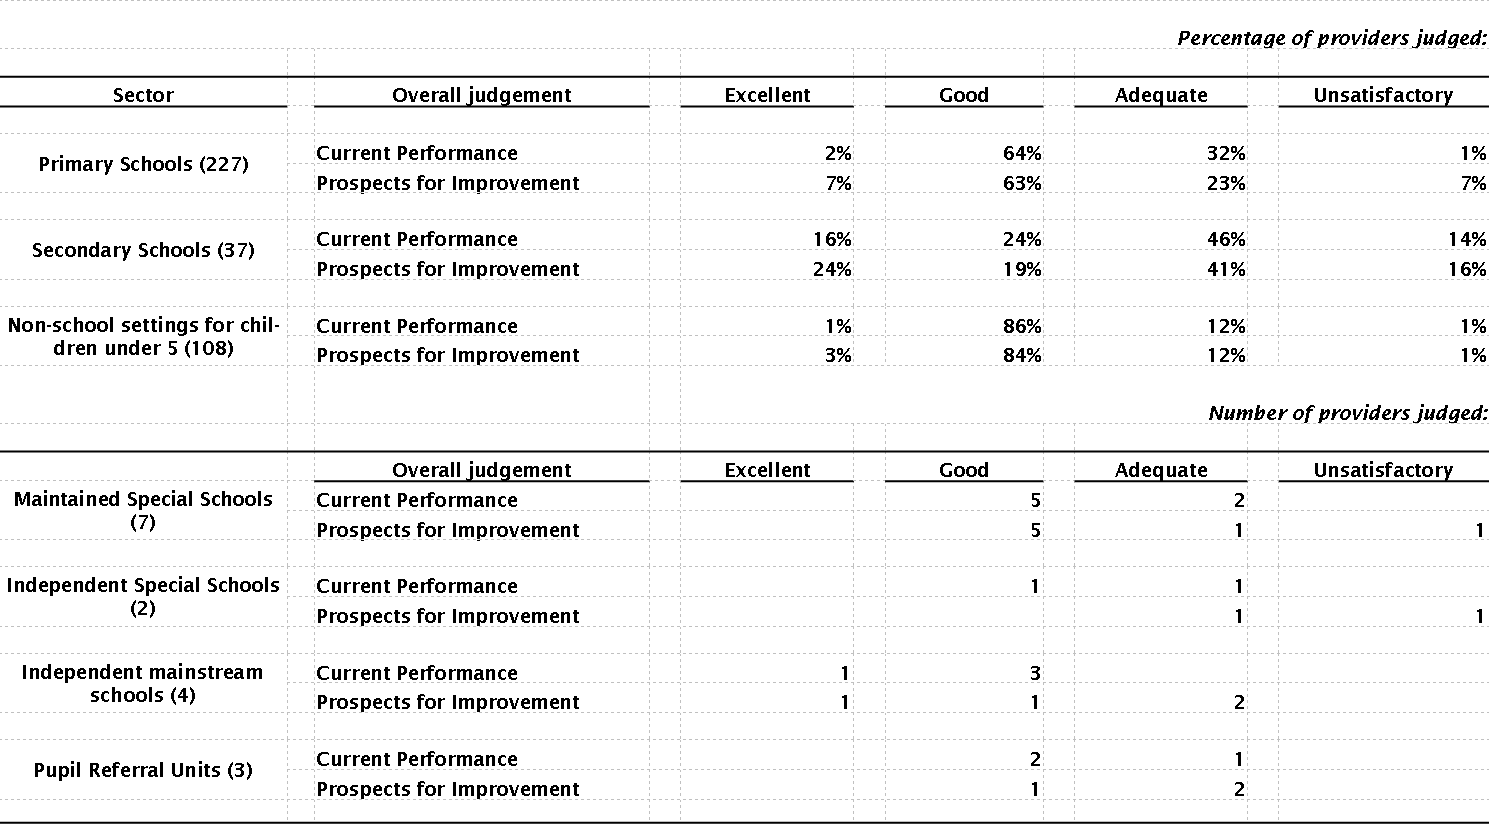 Source: Extracted from Estyn data (data.estyn.gov.wales)
Notes: a) The numbers in brackets after the sectors denote the numbers of settings inspected; b) Percentages may not total 100 due to rounding; c) Figures for categories other than primary and secondary schools, and settings for children aged under 5, have been provided as numbers rather than percentages, due to the small number of providers included.[/caption] Table 2: Inspection Outcomes by Sector 2010/11 - 2014/15 [caption id="attachment_5732" align="alignnone" width="682"]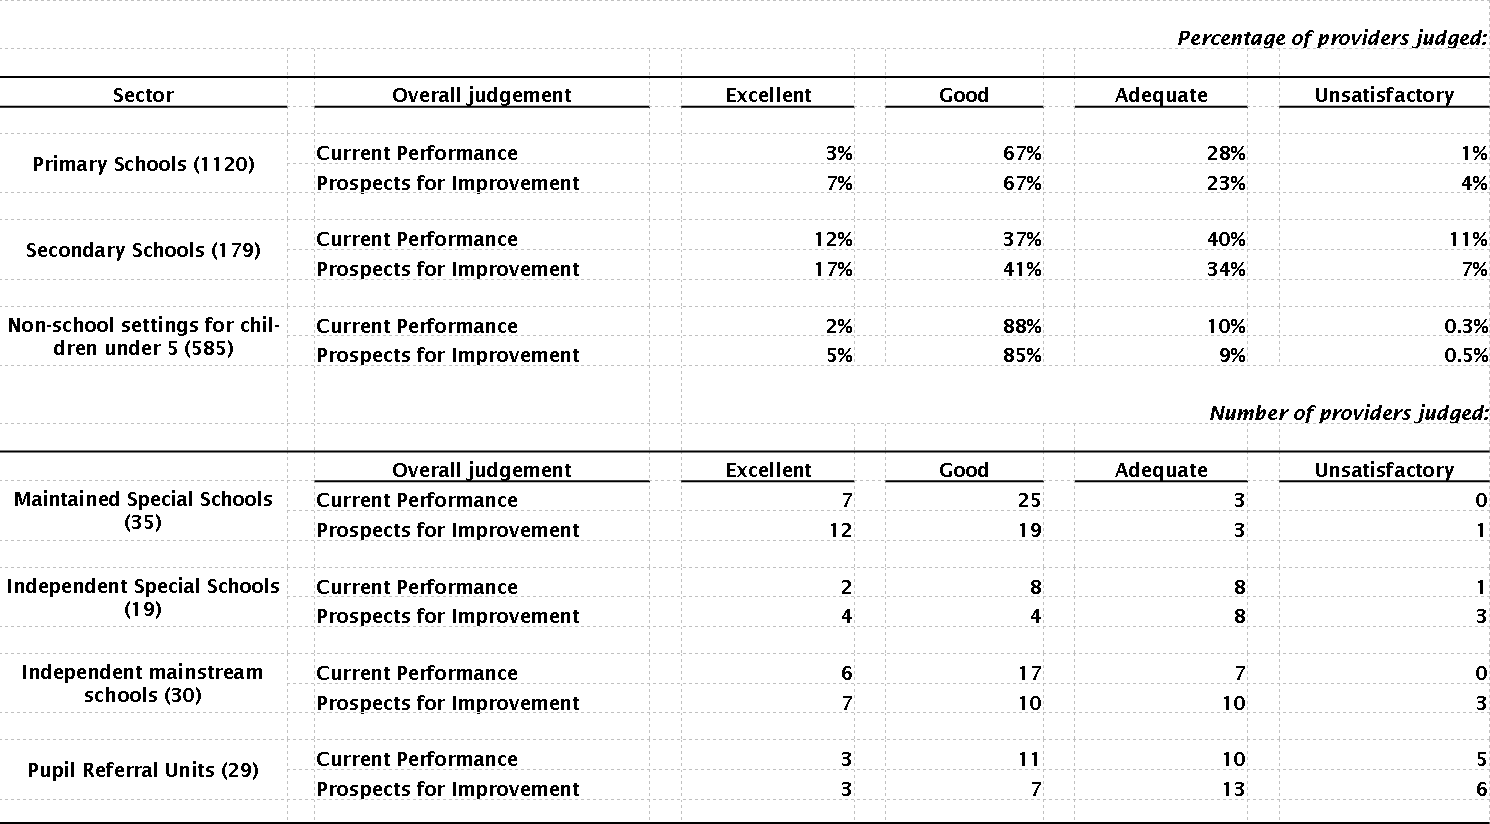 Source: Extracted from Estyn data (data.estyn.gov.wales)
Notes: a) The numbers in brackets after the sectors denote the numbers of settings inspected; b) Percentages may not total 100 due to rounding; c) Figures for categories other than primary and secondary schools, and settings for children aged under 5, have been provided as numbers rather than percentages, due to the small number of providers included.[/caption]
