


Article by Ben Stokes, National Assembly for Wales Research Service
On Wednesday 9 December the Office for National Statistics published the latest estimates of UK regional and sub-regional Gross Value Added (GVA). These figures show that GVA per head in Wales remains the lowest among the devolved countries and English regions. GVA is a measure of the increase in the value of the economy due to the production of goods and services. These regional estimates of GVA are measured using the income approach, which involves adding up the income generated by resident individuals or businesses in the production of goods and services. These statistics are important as they provide an overview of economic performance at regional and sub-regional level, allowing comparison between the countries and regions of the UK. Also, GVA per head estimates are one of the outcome indicators for the Growth and Jobs chapter of the Welsh Government’s Programme for Government. The figures are produced at three levels of geography using the EU standard Nomenclature of Units of Territorial Statistics (NUTS) approach.
- NUTS1: 12 areas in the UK - Wales, Scotland, Northern Ireland and the nine English regions.
- NUTS2: 37 areas or sub-regions in the UK– mainly groups of counties and unitary authorities.
- NUTS3: 139 areas in the UK – mainly individual counties and unitary authorities (also known as local areas)
The GVA estimates at the NUTS 1, 2 and 3 level have all been produced on a workplace basis (i.e. the GVA is allocated to the location where the economic activity takes place). Key points from the data include:
- In 2014, Wales had the second lowest increase in GVA per head of the 12 NUTS1 regions (2.1 per cent). Only Northern Ireland grew by a smaller rate (1.9 per cent).
- GVA per head in Wales in 2014 stood at £17,573, or 71.4 per cent of the UK average (a decrease of 1.1 percentage points on 2013, relative to the UK average).
- GVA per head in Wales in 2014 was the lowest of all the 12 NUTS1 regions of the UK and has been the lowest in each year since 2001.
- At the NUTS2 level, GVA per head in East Wales stood at 84.0 per cent of the UK average, a decrease of 1.8 percentage points on 2013. While GVA per head in West Wales and the Valleys in 2014 was 64.0 per cent of the UK average, a decrease of 0.7 percentage points on 2013.
- In 2014, GVA per head in West Wales and the Valleys was the lowest of all the NUTS2 areas in the UK, standing at 64.0 per cent of the UK average.
- In 2014, the two NUTS3 areas with the lowest GVA per head in the UK were both in Wales (Gwent Valleys at 54.8 per cent of the UK average and the Isle of Anglesey with 53.5 per cent).
Table 1 shows the changes in GVA per head for Wales, and the NUTS2 and NUTS3 areas of Wales, relative to the UK average, over the full time period for which these figures are available. Negative changes are shown in red. 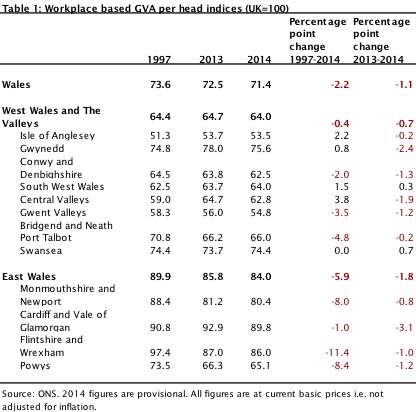 Timeliness One of the limitations of using GVA to understand the current health of the Welsh economy is that the figures are only published once a year and involve a significant time lag. This point was recognised by the Assembly’s Enterprise and Business Committee in its October 2014 report on trade and inward investment, which recommended:
The Welsh Government should take steps to improve the quality and timeliness of the economic statistics that are available for Wales. In particular, the Welsh Government should work with or commission the Office for National Statistics to produce Gross Domestic Product figures for Wales, on the same basis and frequency as it does for the UK.
The Welsh Government accepted this recommendation ‘in part’ and the issue was subsequently considered as part of a review of economic data undertaken by the Chief Economist and Chief Statistician. The findings of the review, published in January 2015, note that “there are a range of options for producing a quarterly indicator of GVA”. As you would expect there are a range of costs involved as well, from the lowest cost option which would involve “minimal” additional cost, up to the “full” GVA approach which would cost “in excess of £1 million with potentially significant recurrent costs”. The review concluded that:
While it is not, therefore, proposed to produce quarterly GVA in the short term to meet the Welsh Government’s own needs, the Chief Statistician will consider further the case for taking forward the lowest cost option, including the benefits and issues with such a measure, should there be a high level of stakeholder demand expressed in the response to future rounds of the routine consultation that is carried out on economic statistics.
Therefore, the current approach of only producing GVA statistics for Wales on an annual basis looks set to continue for the foreseeable future.